 2014, Vol. 35
Shanghai University
Article Information
- Han CHENG, Xin-hua ZHANG, Li YU, Meng CHEN. 2014.
- Study of velocity effects on parachute inflation performance based on fluid-structure interaction method
- Appl. Math. Mech. -Engl. Ed., 35(9): 1177-1188
- http://dx.doi.org/10.1007/s10483-014-1852-6
Article History
- Received 2013-3-6;
- in final form 2013-9-19


2. Aviation Key Laboratory of Science and Technology on Aeronautical Life-Support, AVIC Aerospace Life-Support Industries Ltd., Xiangyang 441000, Hubei Province, P. R. China
The fiercest interaction among structures in the flow field happens during the parachute inflation process. The process involves nonlinear and unsteady problems. Most previous researches regarding the inflation process are based on semi-empirical methods,including the inflation distance method,the inflation time method,the radical momentum equation method and so on [1, 2]. All the above mentioned semi-empirical methods rely on empirical correlations of the drag characteristics and associated air mass obtained by experiments. Some relevant coefficients in those methods depend on the particular parachute style,and cannot get valid values according to the specific working conditions. Thus,the results gained from the above methods fail to give sufficient information,and cannot fully represent the mechanical theory during the inflation process.
With the continuous development of numerical algorithms and upgrading of computer hardware,the fluid-structure interaction (FSI) parachute problem has been attracting more and more scholars’ attention. The computational fluid dynamics (CFD)/mass spring damper (MSD) model which was used in earlier FSI method is based on time-space discretion. In this model, the parachute is dispersed into a series of mass points connected by the springs and dampers whose movement is controlled by the flow field force,spring force,and damping force [3, 4, 5] .The FSI method focuses on the calculation of canopy shape. However,it is unable to obtain the stress distribution of the canopy. Nowadays,the commonly used approach is the deformingspatial-domain (DSD)/stabilized space-time (SST) coupling method,which can get detailed descriptions of the flow field and structures during the inflation process. An interface tracking method was designed to solve the large deformation in coupling calculation[6, 7, 8] ,according to which,both the flow field and the structure were dispersed into a large number of elements. The dynamic grid technology was used to solve two-dimensional (2D) time-space FSI problems of the flat circle parachute during the inflation [8] and cross,ringsail,and other parachutes with simplified initial shapes [9, 10, 11, 12, 13, 14] . Beside the DSD/SST technology,the immersed boundary (IB) method was also proposed to solve the FSI simulation problems of parachute inflation,and was used in the simulation of the cone and cluster parachutes [15] . The methods mentioned above are based on the Navier-Stokes equations and other methods such as the large eddy simulation method used for the FSI simulation of a disk-gap-band parachute in supersonic flow field[16] .
Most previous works of parachute inflation using the space-time FSI technique are based on a supposed initial canopy shape and the simplified structure details. However,they ignore the velocity effects. In this paper,based on the FSI method,the 3D numerical simulation of conical ringslot inflation with different velocities is studied for the first time. The accuracy of the simulation results is verified by experimental data. The velocity effects on canopy shape, opening shock,inflation time,and swinging angle are studied. The proportion coefficient of the semi-empirical method affected by the velocity is obtained. The obtained numerical results can serve as a reference for the selection of empirical coefficients in traditional methods. This coupling calculation was carried out by the DELL T5500 workstation with 12-core and 32G memory. The CPU time consumption was 150 hours. 2 Mathematicalmodel 2.1 Control equation of fluid field
At the inflation stage of the flexible canopy,the flow field grids near the structure will have large deformation. In order to avoid serious distortion of the calculation grids,the simplified arbitrary Lagrange Euler (SALE) method is adopted to calculate the inflation stage of the parachute.
The control equations of the flow field are
whereρis the density,t is the time,vi is the velocity,xj is the Eulerian coordinate,ci is the relative velocity in the reference field,andbi is the body force. σij is the stress tensor of flow field defined by
 ,where p is
the pressure,δij is the Kronecker coefficient,and μis the viscosity. δij,j is the stress tensor of
the structure field defined by
,where p is
the pressure,δij is the Kronecker coefficient,and μis the viscosity. δij,j is the stress tensor of
the structure field defined by  .
.
The initial conditions are u0F=vinlet and p0F= 101 325 Pa. The boundary conditions of the
calculation field are as follows: uinlet = uin the inlet region;
 =0 and
  =0inthe
outlet region; and = 0 in the around region.
2.2 Structure control equation
=0inthe
outlet region; and = 0 in the around region.
2.2 Structure control equation
The control equation of the structure calculation (coupling faces) is

The initial conditions are u0S=0 and σ0S=0. The boundary condition of the lines intersection isuS=0. 3 Numerical arithmetic
In actual wind tunnel experiment,the intersection of lines is fixed. Therefore,the change of the flow field computational domain is limited,and the referenced grids of the flow field in the SALE/FSI method can be fixed in this state.
The method for the parachute structure simulation is based on the Lagrangian arithmetic. The calculation grids are fixed on the structure,and move with the object. Thus,the moving boundary of the parachute can be accurately described.
The flow field calculation shown in Fig. 1 is divided into three distinct sub-steps:
 |
| Fig. 1 Operation of each time step |
(i) Compute the flow field based on the Lagrangian arithmetic,and get the state parameters in the Lagrangian coordinate.
(ii) Smooth the distorted fluid material grids based on the equipotential zoning method,in which the topology relationship of grids does not change.
(iii) Transport the flow field information to the updated grids by advection methods. At the end of Sub-step (iii),the computation is prepared for the next time step. 3.1 Lagrangian arithmetic
In Sub-step (i),the grids move with the material deformation. Therefore,the convective terms and the mass equation in (1) can be ignored. The control equations of the flow field and structure can be simplified as follows:
where
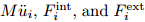 stand for the inertia force,the internal force,and the external force,
respectively. The nodal displacement is calculated based on the discrete equation (3) by the
finite element method. After calculating the nodal acceleration,the centered-differences are
used to find the velocity at the timen+1/2 and the new position of the node at the timen+1.Then,the stress,strain,and other parameters can be obtained at the timen+1. In general,the
time step Δtmust be small enough to guarantee the stability of the calculation. In this work,
the time step is chosen as Δt<Δtc=α(Lmin/c),whereLmin,c,andαstand for the minimum
cell size,the sonic speed of the material,and thezooming factor,respectively. In this work,
α=0.7.
3.2 Smoothing grids
stand for the inertia force,the internal force,and the external force,
respectively. The nodal displacement is calculated based on the discrete equation (3) by the
finite element method. After calculating the nodal acceleration,the centered-differences are
used to find the velocity at the timen+1/2 and the new position of the node at the timen+1.Then,the stress,strain,and other parameters can be obtained at the timen+1. In general,the
time step Δtmust be small enough to guarantee the stability of the calculation. In this work,
the time step is chosen as Δt<Δtc=α(Lmin/c),whereLmin,c,andαstand for the minimum
cell size,the sonic speed of the material,and thezooming factor,respectively. In this work,
α=0.7.
3.2 Smoothing gridsIn this paper,the inlet velocity is constant and the referenced grids of the flow field are fixed during the parachute inflation. After the one-time-step calculation of the flow field is carried out,the fluid material grids will be distorted. Thus,they must be smoothed by the equipotential method developed by Winslow[17] in order to guarantee the grid quality. Equipotential zoning is an approach to establish a structured mesh for finite difference or finite element calculations by solving the Laplace equations (later extended to the Poisson equation). The topological relation of the smoothed mesh is the same as the original one. The new nodal position of the mesh is determined by the following equation based on the equipotential arithmetic:
where
To obtain more even meshes,the simple averaging algorithm is adopted. The coordinate of
a node in the simple averaging algorithm is the average of the coordinates of its surrounding
nodes,i.e., ,where the script SA refers to the simple averaging algorithm.
A composite algorithm is derived with a weighted average of the above two algorithms. The coordinate of a node in the composite algorithm is
where the subscript E refers to the equipotential algorithm,andwis the weighting factor. 3.3 Advection algorithms
As a fluid element moves from its current position at the end of the Lagrange calculation to a new position after the smoothing,there are mass,momentum,and energy fluxes through the six faces of the element. Since advection is merely a geometric update of the mesh,the source terms of the governing equation disappear. The advection equation can be described as follows:

For the three-dimensional problem,the convection terms are discrete,expressed as
where the subscripts A andj refer to the calculation elements and its surrounding elements, respectively. Vis the element volume. The value of fφj depends on the velocity at the nodej, which defines the upstream direction. The staggered mesh algorithm and the monotone upwind schemes for conservation laws (MUSCL) with second-order precision are used to calculate the fluxes of the mass,momentum,and energy through the element faces. 4 Structure and numerical model 4.1 Parameters of parachute
One kind of conical ringslots is involved in this paper for calculation. The parachute is made up of 20 gores and 5 rings. The textile fiber materials of the canopy,suspension,and reinforcement line are brocade,aramid,and brocade silk,respectively. One of the canopy gores is shown in Fig. 2,in which the apex angle is 16.9°.
 |
| Fig. 2 Canopy gore |
For the structure of ringslot,the number of the canopy gores is 20%,the nominal diameter is 6.18 m,the diameter of the vent is 0.274 m,the nominal area is 30 m2,and the length of the line is 7.423 m. For the material properties of the canopy,the density of canopy is 130 g/m2,the Young’s modulus of the canopy is 5.87E+9 Pa,the thickness of the canopy is 0.03 mm,and the Poisson ratio is 0.14. For the material properties of suspension,the density of suspension is 7 g/m,the diameter of suspension is 2.5 mm,and the Young’s modulus of suspension is 6.52E+8 Pa. For the material properties of the reinforcement belt,the density of the belt is 5 g/m,the thickness of the belt is 0.1 mm,the width of the belt is 15 mm,and the Young’s modulus of the belt is 3.42E+9 Pa. For the properties of air,the density is 1.2 kg/m3 ,the temperature of air is 25°C,and the ambient pressure is 1.01E+5 Pa. 4.2 Finite element model
The direct folding modeling technology [18, 19] is used to establish the initial finite element model of the parachute with completely straightened suspensions. The canopy looks like “*” (see Fig. 3). The direct folding modeling method is simple and effective,by which the structure details such as reinforce belt and structural porosity can be described and the folded extent and the initial inlet area can be conveniently adjusted. In this work,the folded angle of the canopy is only 1°,and the initial inlet area of the parachute is just 0.085 m2. The canopy is meshed by 36 200 triangular elements. The suspension and reinforcement belt are meshed by bar elements with 4 760 nodes. The hexahedral elements are used to mesh the flow field,and the number of meshes is over 690 000. The computational domain along the axial,radical,and zonal is 10D0×5D0×5D0,where D0 is the nominal diameter and the length of the wake flow is about 6D0. The initial element model of the flow field and parachute is shown in Fig. 4.
 |
| Fig. 3 Initial model of parachute |
 |
| Fig. 4 Initial grid of parachute and flow field |
The condition set for the calculation is the same as that in the wind tunnel test (see Fig. 5). The airflow velocity is 18 m/s. According to the definition of the Cartesian coordinate system,the vertical,horizontal,and central axes of the parachute are defined as X,Y,andZ, respectively. The start time of the vent opening and the skirt opening is regarded as the initial inflation time and the fully inflated time,respectively. The numerical results of the inflation time and the average projected diameter at the terminal stage are obtained. The numerical results include the projected diameter of vent or skirt,the swinging angle,the opening load (Fk),and the drag area (CA) (see Figs. 6 -8 ).
 |
| Fig. 5 Wind tunnel test |
 |
| Fig. 6 Numerical results of projected diameter |
 |
| Fig. 7 Swinging of ringslot |
 |
| Fig. 8 Opening load and drag area |
The results concluded from this paper are in good agreement with those of the wind tunnel tests (see Table 1). It proves that the SALE method is an efficient FSI method to predict the parachute inflation performance. The even projected diameters of the vent and skirt are 0.52 m and 3.9 m at the terminal stage,respectively (see Fig. 6). The ratio of the inlet projected diameter to nominal diameter is 0.63. They are consistent with the statistical data which ranges from 0.6 to 0.65 [2] .

The numerical results show that the change of the opening shock load is similar to the drag area during the same parachute inflation. However,this correlation is nonlinear. The first peak of the opening loads obtained by either the FSI method or the experimental method appears at about 0.5 s when the vent is completely open. This phenomenon cannot be explained by the empirical formula of the inflation time method (see Fig. 8) [2] . Affected by the air flow preceding peak,the canopy opens gradually from bottom to apex,and the flexible canopy cannot support the bending for its light mass. Therefore,at the initial inflation stage,the upper folded part of the canopy will produce some second folding due to its swinging and twisting caused by the fluid force. When the vent is completely open,the second folding disappears rapidly,and the opening load will jump because of the rapid growth of the deploy area. The first opening shock shown by numerical simulation or experimental method appears at the initial inflation stage, and represents the interactive mechanism of the flow field and structure,which is consistent with the actual situation. However,the time-sequence drag area is assumed to be continuous and smooth [2] ,which does not agree with the practical situation. 6 Velocity effects on parachute inflation performance
When the airflow velocity increases,the mesh deformation becomes more serious,and more computing resources will be consumed. In this work,the inflation processes under different velocities,v=18 m/s,50 m/s,80 m/s,are simulated by the SALE/FSI method. Other conditions are not considered because of the huge computing consumption and subsonic working state of the parachute. The computing results are stable in different velocity states,proving that this numerical method is competent to solve the large deformation problem. In the following calculation cases,the initial model,the material parameters,etc. are the same. 6.1 Inflation time and projected diameter
The time-sequence canopy shapes under different inflatable velocities are shown in Fig. 9. The shape change in 50 m/s is not given because it is similar to the other two cases. The numerical results show that the larger the velocity is,the bigger the effective stress of the canopy is. To display the stress distribution effectively,the stress range is set from 0 Pa to 6E+6 Pa and from 0 Pa to 4E+7 Pa in two velocities,respectively.
 |
| Fig. 9 Canopy shapes with stress |
The time-sequence projecteddiameters of the vent and skirt are shown in Figs. 10 and Fig. 11. Table 2 displays the inflation time and projected diameter based on the SALE/FSI method. The results are compared with those obtained by the semi-empirical inflating distance method [2] . The projected diameter is a statistical value summarized frommany tests. The time-sequence structure details of the parachute cannot be obtained by any previous semi-empirical method.
 |
| Fig. 10 Vent projected diameter |
 |
| Fig. 11 Swing of parachute in wind tunnel tests |

The canopy shape changes are clearly shownin Figs. 9-11. Some laws can be found. Firstly, when the velocity increases,the canopy shape is more close to a streamlined body at the terminal stage,while the skirt projecteddiameter decreases and the vent diameter increases. Secondly, the larger the velocity is,the faster the parachute inflates,leading to a shorter inflation time.
In Table 3,the results of the FSI method are well consistent with those gained from the semi-empirical method. The space-time FSI method fully considers the effects of the structure details and the working conditions. According to the numerical results,the inflation distance proportion coefficients under different velocities obtained by the SALE/FSI method can be obtained (see Fig. 12). It shows that the inflation distance proportion coefficient increases with the increase in the velocity.

 |
| Fig. 12 Inflation distance proportion coefficients in different velocities |
The numerical results of swinging under different velocities are shown in Fig. 13. The numerical results of the swinging of a ringslot at the terminal stage in the wind tunnel test are shown in Fig. 14. The swinging characteristics can be summarized as follows:
 |
| Fig. 13 Swinging of ringslot |
 |
| Fig. 14 Skirt projected diameter |
Firstly,the parachute deviates from the center position at the terminal stage because it is difficult for the flow field to keep absolutely symmetric both in the wind tunnel experiment and in the numerical calculation. In addition,the canopy structure is usually not absolutely symmetric due to some manufacturing defects. Secondly,it can be seen from Fig. 13 that this ringslot has good stability because the maximum swinging angle is only 2.68°at 18 m/s. This characteristic is confirmed by the wind tunnel test and the towing test,according to which the measured swinging angle is about 3°.
Finally,the results show that the swinging angle decreases and the swinging frequency increases with the increase in the velocity (see Fig. 13). The swinging law affected by the velocity is well consistent with the measured results obtained by the wind tunnel test (see Fig. 14). 6.3 Opening load and drag characteristics
Figures 15 and 16 show the time-sequence drag areaCAand the opening load Fk with
different velocities by the SALE/FSI method. Table 3 displays the comparison of the drag
area and the opening load obtained by the SALE/FSI method and the traditional method.
According to the results based on the traditional method,the drag area is estimated by the
empirical value. The value of the drag coefficient is in the range of 0.56-0.65
[2]
,and the opening
shock is calculated based on the dynamic load coefficient method,Fkmax=
 ρv2(CA)kd,where
the dynamic load coefficient kd is 1.05
[2].
ρv2(CA)kd,where
the dynamic load coefficient kd is 1.05
[2].
As shown in Figs. 15 and 16 and Table 3,it is clear that the numerical results are well consistent with the results obtained by the previous empirical value or semi-empirical method. Moreover,the following results can be found:
 |
| Fig. 15 Drag area in different velocities |
 |
| Fig. 16 Opening load in different velocities |
(i) The drag area decreases slightly with the increase in the velocity,which shows that the effect of the velocity on the drag area is not significant.
(ii) With the increase in the velocity,the second folding phenomenon caused by swinging and twisting will disappear. Therefore,the jumps of the drag area and opening shock are not obvious when the vent is completely open.
(iii) When the velocity increases,the opening load increases significantly. The numerical result of the opening shock agrees with that obtained by the semi-empirical method. According to the numerical results of the opening shock and its velocity shown in Table 3,the dynamic load coefficient can be calculated (see Fig. 17). It shows that the dynamic loadcoefficient decreases with the increase in the velocity.
 |
| Fig. 17 Dynamic load coefficients in different velocities |
In this paper,the space-time SALE/FSI method is used to simulate a folded parachute inflation with different velocities. The calculation results are well consistent with the results obtained by the experiments or empirical methods. The results show that the present numerical method is capable of solving large deformation parachute problems. In addition,the following conclusions can be summarized:
(i) With the increase in the velocity,the canopy opening time becomes shorter and the canopy shape is more close to a streamlined body at the terminal stage.
(ii) The swinging angle and frequency are also influenced by the velocity. When the velocity increases,the swinging angle decreases and the frequency increases.
(iii) When the velocity increases,the first opening shock at the initial inflation stage may not appear. The opening shock increases significantly but the drag area decreases slightly when the velocity increases.
(iv) According to the numerical results based on the FSI method,both the inflation distance proportion coefficient and the dynamic load coefficient are influenced by the velocity. However, based on the semi-empirical or empirical method,these coefficients are barely related to the canopy type.
The SALE/FSI technique is able to reveal the mechanical mechanism of parachute working processes. A large amount of space-time information of fluid-structure-motion can be obtained by this method. Furthermore,without relying on empirical coefficients,the working parachute process can be studied when specified fabric material,parachute dimension,working state,etc. are taken into consideration.
Acknowledgements The authors are grateful to Xiao-xue YAN for her carefully polishing.
| [1] | Peng, Y., Cheng, W. K., Song, X. M., and Zhang, Q. B. Summery for the research methods of parachute inflation process. Chinese Space Science and Technology, 24, 38-44 (2004) |
| [2] | Wang, L. R. Parachute Theory and Application (in Chinese), Space Navigation Press, Beijing, 187-229 (1997) |
| [3] | Stein, K. R., Benney, R. J., and Steeves, E. C. A Computational Model that Couples Aerodynamic Structural Dynamic Behavior of Parachutes During the Opening Process, NASA, ADA264115 (1993) |
| [4] | Yu, L. and Ming, X. Study on transient aerodynamic characteristics of parachute opening process. Acta Mechanica Sinica, 23, 627-633 (2007) |
| [5] | Yu, L., Shi, X. L., and Ming, X. Numerical simulation of parachute during opening process (in Chinese). Acta Aeronautica et Astronautica Sinica, 28, 52-57 (2007) |
| [6] | Tezduyar, T. E., Behr, M., and Liou, J. A new strategy for finite element computations involving moving boundaries and interfaces—the deforming-spatial-domain/space-time procedure: I. the concept and the preliminary numerical tests. Computer Methods in Applied Mechanics and Engineering, 94, 339-351 (1992) |
| [7] | Tezduyar, T. E., Behr, M., and Mittal, S. A new strategy for finite element computations involving moving boundaries and interfaces—the deforming-spatial-domain/space-time procedure: II. computation of free-surface flows, two-liquid flows, and flows with drifting cylinders. Computer Methods in Applied Mechanics and Engineering, 94, 339-351 (1992) |
| [8] | Stein, K., Benney, R., and Kalro, V. Parallel computation of parachute fluid-structure interactions. Proceedings of the 14th AIAA Aerodynamic Decelerator Technology Conference, San Francisco, AIAA-97-1505 (1997) |
| [9] | Kalro, V. and Tezduyar, T. A parallel 3D computational method for fluid-structure interactions in parachute systems. Computer Methods in Applied Mechanics and Engineering, 190, 321-332 (2000) |
| [10] | Stein, K., Benney, R., Kalro, V., Tezduyar, T. E., Leonard, J., and Accorsi, M. Parachute fluidstructure interactions: 3-D computation. Computer Methods in Applied Mechanics and Engineering, 190, 373-386 (2000) |
| [11] | Stein, K., Benney, R., and Tezduyar, T. Fluid-structure interaction of a cross parachute: numerical simulation. Computer Methods in Applied Mechanics and Engineering, 191, 673-687 (2001) |
| [12] | Tezduyar, T. E., Sathe, S., Pausewang, J., Schwaab, M., Christopher, J., and Crabtree, J. Fluidstructure interaction modeling of ringsail parachutes. Computational Mechanics, 43, 133-142 (2008) |
| [13] | Takizawa, K., Wright, S., Moorman, C., and Tezduyar, T. E. Fluid-structure interaction modeling of parachute clusters. International Journal for Numerical Methods in Fluids, 65, 286-307 (2011) |
| [14] | Takizawa, K., Spielman, T., Moorman, C., and Tezduyar, T. E. Fluid structure interaction modeling of spacecraft parachutes for simulation-based design. Journal of Applied Mechanics, 79, 1-9 (2012) |
| [15] | Yongsam, K. and Charles, S. P. 3-D parachute simulation by the immersed boundary method. Computers and Fluids, 38, 1080-1090 (2009) |
| [16] | Karagiozis, K., Kamakoti, R., Cirak, F., and Pantano, C. A computational study of supersonic disk-gap-band parachutes using large-eddy simulation coupled to a structural membrane. Journal of Fluids and Structures, 27, 175-192 (2011) |
| [17] | Winslow, A. M. Numerical solution of the quasilinear Poisson equation in a nonuniform triangle mesh. Journal of Computational Physics, 135, 128-138 (1997) |
| [18] | Ma, C. S., Yue, H., and Huang, S. L. A study on airbag folding patterns for improving occupant protection effectiveness. Automotive Engineering, 27, 350-353 (2005) |
| [19] | Cheng, H., Yu, L., and Yin, Z. W. A new method of complicated folded fabric modeling. Journal of Harbin Institute of Technology, 19, 43-47 (2012) |