 2015, Vol. 36
Shanghai University
Article Information
- N. ZHAO, K. IRAMINA. 2015.
- Numerical simulation of effect of convection-diffusion on oxygen transport in microcirculation
- Appl. Math. Mech. -Engl. Ed., 36(2): 179-200
- http://dx.doi.org/10.1007/s10483-015-1908-7
Article History
- Received 2014-05-24;
- in final form 2014-08-23


2. Department of Informatics, Graduate School of Information Science and Electrical Engineering, Kyushu University, Fukuoka 819-0395, Japan
Oxygen is primarily carried in the form of oxyhemoglobin,that is,bound to the hemoglobin (Hb) molecules inside red blood cells (RBCs). The process that oxygen is released from RBCs to plasma and is transported to cells is accomplished in the microcirculation[1]. The microcirculation, which comprises arterioles,venules,and capillaries,is very different from that in large arteries and it is appropriate to consider the flow properties within them separately. Understanding the oxygen transport properties at micro level is a difficult and fundamental topic and it is helpful for gaining insight into a number of diseases that involve the microcirculation[2, 3, 4]. Capillaries are where fluid,gasses,nutrients,and wastes are exchanged between the blood and body tissue by diffusion. Capillary walls contain small pores that allow certain substances to pass into and out of the blood vessel. Water and small solutes are allowed to pass through its pores but proteins are not allowed. As blood enters the capillary bed on the arteriole end, fluid moves from the vessel to the body tissue. At the middle of the capillary bed,fluid passes equally between the capillary vessel and the body tissue. Oxygen is also exchanged at this point. On the venule end of the capillary bed,fluid,carbon dioxide and wastes are drawn from the body tissue into the capillary vessel[5, 6].
Various theoretical,experimental,and numerical studies have been performed. The first attempt to mathematically describe the phenomenon of oxygen supply to living tissues through the microcirculation of blood was the classical Krogh’s model[7]. This model dealt with an idealized geometric arrangement,consisting of one capillary of circular cross-section concentric with a circular cross-section of muscle tissue. This pioneering theoretical model was built on a number of idealized assumptions,including constant oxygen consumption rate,uniform oxygen diffusivity,and homogeneous capillary distribution[8]. The derivation of this model in tissue sub-domain was found,in terms of the diffusion equation[9]. Since then,much attention has been focused on the role of oxygen transport to tissues,leading to more advanced mathematical models for the movement of oxygen,incorporating variable oxygen consumption rate, intravascular oxygen transport resistance,myoglobin (Mb) facilitated diffusion,axial oxygen diffusion in the tissue,time dependent oxygen transport,pre- and post-capillary transport and flow redistribution[10, 11, 12]. In early studies,tissue oxygen consumption was often assumed to be uniform,then oxygen dependent consumption was proposed to simulate the oxygen delivery under hypertension[13] and under the condition of high oxygen demand[14]. A global existence of a unique smooth solution of the nonlinear diffusion of oxygen in tissue,in presence of consumption due to metabolism,was discussed[15]. Yulianti and Gunawan proposed a critical ratio between supply and consumption of oxygen in tissue region in order to fulfill cell’s oxygen requirements[16].
In addition,axial oxygen diffusion in the tissue has been found important for the transport of solute in microcirculation,but axial diffusion inside following capillaries is less important due to the relatively greater effect of axial convection[17]. An asymptotic solution for a diffusion problem in 2D to describe oxygen transport from multi-capillaries to skeletal muscle tissue was studied[18] and a system of ordinary differential equations for oxygen transport in 2D array of capillaries were coupled with a system of algebraic equations for the fluxes[19]. Several studies used time-dependent Krogh-type models since the convective oxygen supply to individual capillaries could vary considerably over time and there were many problems of interest in which time dependent oxygen transport is relevant[20]. Arterioles and venules were also involved in blood-tissue diffusive oxygen transport,and it was important to understand how they carry oxygen and release oxygen to tissue[21, 22].
Lots of theoretical models for solute transport based on porous medium mechanics were established[23, 24, 25, 26]. Schuff presented a comprehensive model that included transport in the vessel lumen,the vessel wall,and the interstitial space and considered the effect of the solute concentration on fluid flow[27, 28]. This was used to examine fluid and solute transport for simplified case of an axisymmetric geometry but no solid deformation.
Though the knowledge of oxygen transport has revealed that oxygen has the ability to transport from any capillary to another location under the conditions in which there exists a large enough oxygen tension gradient and that the seepage for oxygen along the intervening pathway is sufficient[29, 30],the effect of convection-diffusion and deformation of tissue scaffold had not been paid sufficient attention. It was generally viewed that convection of oxygen within tissue could be neglected because many studies considered that tissue fluid flowed very slowly within tissues. However,the deficiency remains existing in studying for seepage of tissue fluid: seepage might be significantly affected by the deformation of microcirculatory structure which could be caused by capillary fluctuation. The deformations at micro level are very difficult to be measured by the experiments biologically. Thus,the deformation was considered and studied in some relevant mathematical models[31, 32]. Therefore,we take account of oxygen transport in deformable porous media,where the volumetric deformation is modelled based on the pressure variations of capillary fluctuation from experiments[33].
In the present study,we develop a mathematical model based on a porous medium mechanics, coupling solid deformation of tissue scaffold,fluid seepage,convection-diffusion and molecular diffusion,and study the convection-diffusion of oxygen on oxygen transport at micro level, especially within tissue. Based on this more comprehensive model,the effects of seepage, deformation,and convection-diffusion on oxygen transport are discussed and the numerical results of the distributions of pore pressure,seepage velocity,and oxygen concentration are presented as below. 2 General coupled mathematical model with solid deformation,fluid seepage, and convection-diffusion and molecular diffusion
A general system of the coupled mathematical model for solute transport in microcirculation with solid deformation,fluid seepage,and convection-diffusion and molecular diffusion of solute is presented below. 2.1 Basic assumptions
Based on physiological regulations of oxygen transport in the microcirculation,the assumptions are proposed as follows:
(i) The computational domain is modelled as a porous medium,which is assumed to be isotropic and uniform.
(ii) Solid scaffold in the porous medium is modelled as continuously elastic,of which deformation complies with Hooke’s law.
(iii) The microcirculatory system is assumed to be a saturated porous medium due to the fact that the interstitial space is normally filled with tissue fluid.
(iv) The volume deformation of the saturated porous medium includes two parts: the deformation of solid framework and pore[34]. Since the volume deformation of framework is substantially smaller than that of pore,we assume the volume deformation of the porous medium to be equal to pore deformation.
(v) The pore pressure in the tissue complies with Biot’s effective stress law.
(vi) The fluid seepage complies with Darcy’s law.
(vii) Mass transport by convection-diffusion and molecular diffusion follows Fick’s law.
(viii) The microcirculatory system is considered as a thermodynamic equilibrium system. 2.2 Governing equations of solid deformation Capillary network and cells are modelled as solids,while all other phases are fluids. From the assumption (ii),solid deformation can be expressed by General Hooke’s equation
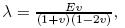
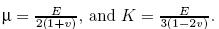
where σ'ij is the effective stress tensor,εij is the strain tensor,λ and μ are the Lam´e constants, e is the volumetric deformation,δij is the Kronecker tensor,K is the volume modulus,Θ' is the effective volume stress,and σ'x ,σ'y ,and σ'z represent the effective stresses in the x-,y-,and z-directions,respectively. According to the assumption (v),the total stress can be expressed as The stress equilibrium can be written as Substituting (3) into (4),we get Substituting (1) into (5),we get the solid deformation equation taking into account the pore pressure expressed by the displacement which is the Lam´e-Navier equation,i.e., Assume that the compression strain is positive and the tensile strain is negative. λ and μ are the Lam´e coefficients,Fi is the external force,α = 1 is the effective stress coefficient,p is the pore pressure,and ui,j is the displacement tensor. In addition,λ,μ,and K all can be expressed as the function of the Young modulus E and the Poisson ratio v of material,i.e.,


 2.3 Governing equations of fluid seepage
The mass equilibrium equation for per unit volume of fluid is given by
where ρ is the density of fluid,t is time,n is porosity,q is the seepage velocity of fluid with
the unit 'volume/time/area”,i.e.,cm3·s−1·cm−2=cm/s,and W is the source or sink of fluid.
According to the assumption (vi),we have qi = kijp,j,where p is the pore pressure in (3),
and kij is the permeability coefficient. From assumptions (iii) and (iv),∂e/∂t = −∂n/∂t . Because
of the micro compressibility of fluid,∂ρ/∂t = −βρ∂p/∂t ,in which β is the compressibility coefficient
of water. Substituting them into (7),we get div (ρ q) = −ρ∂e/∂t − βρn∂p/∂t −W finally. The fluid
seepage equation taking account of solid deformation is
where βn indicates the compressibility coefficient of the tissue fluid,and k (Θ,p) is given to
be constant for assumption (i) in Table 1. Comparing with the oxygen transport model that
only considers molecular diffusion,some modifications in this coupled mathematical model are
shown as follows:
2.3 Governing equations of fluid seepage
The mass equilibrium equation for per unit volume of fluid is given by
where ρ is the density of fluid,t is time,n is porosity,q is the seepage velocity of fluid with
the unit 'volume/time/area”,i.e.,cm3·s−1·cm−2=cm/s,and W is the source or sink of fluid.
According to the assumption (vi),we have qi = kijp,j,where p is the pore pressure in (3),
and kij is the permeability coefficient. From assumptions (iii) and (iv),∂e/∂t = −∂n/∂t . Because
of the micro compressibility of fluid,∂ρ/∂t = −βρ∂p/∂t ,in which β is the compressibility coefficient
of water. Substituting them into (7),we get div (ρ q) = −ρ∂e/∂t − βρn∂p/∂t −W finally. The fluid
seepage equation taking account of solid deformation is
where βn indicates the compressibility coefficient of the tissue fluid,and k (Θ,p) is given to
be constant for assumption (i) in Table 1. Comparing with the oxygen transport model that
only considers molecular diffusion,some modifications in this coupled mathematical model are
shown as follows:


(I) Considering the interaction with fluid seepage and solid deformation of cells and capillary wall,the term ∂e/∂t is added into the seepage (8).
(II) The term (αp),i is added into the solid deformation (6). 2.4 Governing equations of convection-diffusion and molecular diffusion
From the assumption (vii),the diffusion flux can be expressed by Fick’s tensor equation, i.e.,
where Ji is the diffusion flux tensor,C is the concentration of solutions and the function of time and position,and Dij is the diffusion coefficient. The mass conservation for oxygen in the microcirculation is given as where the seepage velocity of fluid is q in (7). Vi in (10) also indicates seepage velocity of fluid because Vi is commonly used in the convection-diffusion and molecular diffusion equation. I is a source and sink term of oxygen related to oxygen solubility in fluid and oxygen consumption. The first term on the right side indicates oxygen transport by molecular diffusion,and the second term indicates oxygen transport by convection-diffusion. 2.5 Coupled model

The coupled model for oxygen transport consists of (6),(8),and (10) as follows:
All the equations expressed as tensor are solved by the finite element method (FEM). 3 Application of coupled model for oxygen transport
Based on the above coupled model for solute transport,this section focuses on the oxygen distribution in microcirculation. CO2 is necessary for solving (10) and is calculated by using the oxygen partial pressure in plasma PO2 . 3.1 Hemoglobin saturation
Oxygen is carried dissolved in the plasma,but to a much lesser degree. Hemoglobin is the primary vehicle for transporting oxygen in the blood. The relationship between the fractional saturation of hemoglobin with oxygen of SO2 and blood oxygen partial pressure of PO2 is proposed by the most common equation of two-parameter Hill’s equation as follows:
where P50=3 626.4Pa is the oxygen tension at 50% saturation,and the dimensionless exponent is m = 2.6. When the arterial blood reaches the capillary bed,its PO2 ,oxygen partial pressure in plasma,is about 12 665.6Pa on arteriole end,while PO2 in the interstitial tissue averages only 5 332.9Pa and entering the systemic veins is also about 5 332.9Pa[35]. Therefore,we take PO2=12 665.6Pa in arteriole end and PO2=5 332.9Pa in venule end. The total oxygen volume concentration within capillary vessel can be expressed as The first term on the right side indicates the concentration of oxygen bound to Hb where φ = 0.45 is the volume concentration of RBCs in blood,δ = 0.25 is the volume concentration of Hb in RBC,and SO2 is obtained from (12). The second term indicates that concentration of oxygen dissolved in plasma follows Henry’s Law,where KO2 is solubility of oxygen in plasma in the human body. 3.2 Oxygen exchange between RBC and plasma

Because oxygen bound to Hb has to dissociate from Hb and pass through RBC membrane into plasma,oxygen molecules can pass through the capillary wall into the tissues. Here,the following assumptions about the source for oxygen are proposed:
(i) Reduced oxygen in suspension in RBC to diffuse into the plasma can be supplied instantaneously from oxygen dissociated from Hb.
(ii) Oxygen can be transported instantaneously through the RBC membrane.
(iii) Hb concentration is considered as a constant in the process of oxygen bound to Hb and dissociated from Hb.
(iv) The molecular of Hb is much larger than that of oxygen,so whether oxygen absorbed in Hb or released from Hb,the diffusion coefficient of Hb remains a constant.
t0 is the initial time. Assume that CO2 in plasma decreases ΔC (x,t0) from t0 to t1. Then, CO2 at t1 can be expressed as
Since capillary CO2 decreases,PO2 also decreases to PO2 (x,t1). From the assumptions,CO2 also can be expressed by (13) as follows: where SO2 is the function of PO2 and can be computed from (12) as follows: Combining (14) and (15) and substituting (16) into (15) to get the results of PO2 (x,t1),which is O2 partial tension at t1 with decrease of oxygen concentration. From assumption (ii) in this section,oxygen partial pressure is changed instantaneously to P'O2 (x,t1) which can be obtained by (15) as follows: where P'O2 (x,t1) also can be used as the value of PO2 (x,t2) at t2. The optimization method is used for solving CO2 from (17),owing to the calculation error of the least squares solution is very small,only 0.434 5 × 10⁻⁴. 3.3 Source and sink of oxygen


Two essential parameters of the density of cells and oxygen consumption rate for body cells are necessary to solve oxygen transport problem. Here,cells consume oxygen is known at a rate of 6.25 × 10⁻¹⁷M· cells−1 · s−1[36]. Assume the tumor cells density in tissues as 6.7 × 10⁷ cells · mL−1[37],and since we know that 1M of oxygen occupies 22 400 mL,then we calculate CusedO2= 6.25×10−17×6.7×107×22 400 = 9.38×10⁻⁵ mL · mL−1 · s−1. Because the parameters of cells density in tissue and oxygen consumption rate would alter in the different organs,even normal cells and tumor cells,here we assume oxygen consumption rate for normal body cells,i.e.,CusedO2= 5.38 × 10⁻⁵ mL · mL−1 · s−1. This mathematical model is solved by the FEM,where each element represents as a volume unit,not a single cell. 3.4 Capillary fluctuation
Capillary fluctuation acts as the source power for solid deformation. There are several time scales of pressure variation within a given capillary. First,there are cardiac oscillations,which could be observed throughout the length of the capillary. Their normal amplitude is about 0.01- 0.02×10⁴N·m−2 (Type I). The propagation of these oscillations through the microcirculation is discussed below. The second form of these fluctuations is one lasting for 15-20 s and is associated with pressure variation in the region of 0.04-0.07×10⁴N·m−2; the pattern of such changes is random (Type II). The third type of pressure variation is more substantial and lasts longer. It is in the region of 0.13×10⁴N·m−2 and occurs over a period of 5-8 min,followed by a return to the steady state condition in about 2-3min (Type III)[33, 38]. 4 Numerical simulation on oxygen transport by convection-diffusion and molecular diffusion 4.1 Geometry and boundary conditions of model
Parallel capillary-tissue cylinder arrangement was proposed by Ref. [7] and is widely applied to study many problems on microcirculation. The oversimplification of real situation introduces the concept of repetitive unit structure. Such a unit structure implies that each section of capillary is responsible for the supply of a corresponding cylindrical section of the surrounding tissue. In order to model more realistic phenomenon of oxygen supply,arteriole end and venule end are incorporated. Since the main aim of this paper is to examine the effect of convectiondiffusion on oxygen distribution,a single parallel capillary tissue as computational model is employed,but complex capillary network is not incorporated.
Geometry and boundary conditions of the physical model are shown in Fig. 1. The radius of capillary is 3 μm,the thickness of capillary wall is 0.3 μm,the distance between two parallel capillaries is 36 μm,and the length of capillaries is 630 μm. For the solid deformation model, normal displacement on all six surfaces is zero; for seepage model,the permeability flux is assumed to be zero on all six surfaces of our model,i.e.,the directional derivative of pore pressure p,∂p/∂n = 0; for the convection-diffusion and molecular diffusion model,the directional derivative of oxygen concentration ∂CO2/∂n = 0 on all of six surfaces. On arteriole end of the capillary,Pt0= 0.26N/cm2 respectively at the x-,y-,and z-directions of all the nodes and CO2 (t0) = 0.001 664 cm3/cm3 (calculated from (13)).
 |
| Fig. 1 Geometry and physical conditions of (a) solid deformation model,(b) seepage model,and (c) convection-diffusion and molecular diffusion model |
The program flowchart for FEM method is shown in Fig. 2. Solid deformation and fluid seepage model are solved by iterative method,then the seepage velocity is substituted into (10) to obtain the oxygen concentration of convection-diffusion. The computational time step Δt=0.062 5 s is used for making the results of oxygen distribution to present the regulation of oxygen transport more clearly and more definitely. Parameters used for this coupled mathematical model are shown in Table 1.
 |
| Fig. 2 Flowchart of FEM program for time-dependent oxygen transport model where Δt=0.062 5 s and t0=0 s |

In the present model,we combine solid deformation into seepage and obtain the results of the seepage velocity from the coupled deformation and seepage model,then use the seepage velocity as the velocity for convection-diffusion to calculate the oxygen concentration.
As described in Sections 3 and 4,the present model considers capillary fluctuations as a power source,so the wave pattern of fluctuations must be represented accurately and completely. Some numerical tests are carried out to determine an appropriate time step. The results indicate that the wave pattern of capillary fluctuations can be simulated well at 1/16 s,but there is only a small difference (relative error of 0.5%) when using 1/32 s. Thus,we select a time step of 1/16 s for the entire computational process,and the pressure at the inlet end of capillary over time which can represent the wave pattern of capillary fluctuation is shown in Figs. 3(a) and 3(b),where two sets of time are marked,i.e.,t1,t2 and t3,t4 represent the pressure under the impact of capillary fluctuation from trough to peak. Correspondingly,the relative volumetric deformation distributions from t1 to t2 and t3 to t4 are presented by percentage in Figs. 3(c) and 3(d). This clearly indicates that capillary fluctuation has a greater effect on volumetric deformation in the middle of capillary region than around the inlet end and around the outlet end,and the largest value of relative volumetric deformation from trough to peak reaches about 0.7% when k1 = 8×10⁻⁶ cm · s−1,and reaches about 0.8% when k1 = 8×10⁻⁷ cm · s−1. The greatest deformation appears in the tissue where surrounds the middle of capillary and is furthest from capillary.
 |
| Fig. 3 Effect of capillary fluctuation on volumetric deformation: pressure in inlet end of capillary over time,when (a) k1 = 8× −6,(b) k1 = 8× −7; percentage of volumetric deformation under impact of capillary fluctuation in some xy-slices,(c) at z=225 μm (left),z=325 μm (middle),z=425 μm (right) from t1 to t2 shown in (a) when k1 = 8× −6,(d) at z=225 μm (left),z=325 μm (middle),z=425 μm (right) from t3 to t4 shown in (b) when k1 = 8 × 10⁻⁷ (unit of k1 is cm · s−1) |
The seepage could be affected by solid deformation which is caused by capillary fluctuation, and the distributions of pore pressure under the impact of volumetric deformation of microcirculatory structure are shown in Fig. 4,which exemplifies the change of pore pressure from trough to peak in half a second corresponding to the volumetric deformation presented in Figs. 3(a) and 3(c). These results indicate that with the increasing pressure of capillary resulting from capillary fluctuation,capillary and tissues would be deformed and as a result the pore pressure is increased.
 |
| Fig. 4 Example of distribution of pore pressure from trough to peak in half second at z=350 μm when k1 = 8 × −6 cm · s−1: (a)-(i) time points corresponding to period from t1 to t2 in Fig. 3(a) with time step of 1/16 s; (j) curve of pore pressure within capillary and average pore pressure at z=350 μm between t1 and t2 |
According to the experimental data on three forms of the capillary fluctuation within a given capillary (details in Sections 3 and 4),they correspond to three extreme values for the pressure variations in the arteriole end,i.e.,pinlet=0.39N/cm2 basically,pinlet=0.546N/cm2 with the fluctuations of Types I and II,pinlet=0.611N/cm2 with the fluctuation of Types I,II, and III. When the values of pinlet are the three extreme values,Fig. 5 shows their pore pressure distributions in xy-slices along the direction of blood flow. Comparing these results,the same pore pressure behavior can be observed.
 |
| Fig. 5 Comparison of distribution of pore pressure in xy-slices corresponding to three extreme values of capillary fluctuation,i.e.,values of pore pressure in inlet end are respectively 0.39 (left column),0.546 (middle column),0.611 (right column) with unit of N/cm2. These xy-slices locate at (a) z=0μm,(b) z=50 μm,(c) z=250 μm,(d) z=500 μm,(e) z=550 μm,(f) z=630 μm, and (g) average pore pressure along z-direction with k1 = 8× −6cm · s−1 |
(i) The pressure gradient decreases along the direction of blood flow.
(ii) Within the tissue surrounding the middle capillary,the pore pressure decreases in the direction from the capillary to the tissue.
(iii) The pressure varies slightly in the region surrounding the middle capillary. 5.2.3 Seepage velocity distribution
The seepage velocity distribution at t=133.062 5 s,pinlet = 0.39N/cm2 is shown in Figs. 6 and 7. Figure 6 shows the seepage velocity distribution in each xy-slice,which also indicates that counter-current flow occurs near the arteriole end and venule end of capillary. It is in agreement with the findings from the pore pressure distribution. The seepage velocity distribution in each yz-slice is shown in Fig. 7. The velocity of tissue fluid in the middle of capillary,changes little in the direction of blood flow. Within the tissues which are further away from the capillary, the lower velocity is.
 |
| Fig. 6 Seepage velocity distribution of fluid with unit of cm·s−1 at t = 133.062 5 s,pinlet=0.39 N/cm2, and k1 = 8 × −6 cm · s−1. Sub-figures are all located in xy-slice and respectively at (a) z=25 μm,(b) z=75 μm,(c) z=225 μm,(d) z=425 μm,(e) z=525 μm,and (f) z=615 μm. Color scale shows magnitude of Vi on xy-plane,and arrows indicate seepage direction |
 |
| Fig. 7 Distribution of seepage velocity along direction of blood flow with unit of cm · s−1 at t=133.062 5 s,pinlet = 0.39N/cm2,and k1 = 8 × −6 cm · s−1. Sub-figures are all located in yz-slice and respectively at (a) x=0.75 μm,within capillary,(b) x=3.15 μm,at capillary wall,(c)-(g) within tissue: (c) x=5.25 μm,(d) x=7.50 μm,(e) x=10.50 μm,(f) x=13.50 μm, and (g) x=16.50 μm. Color scale shows magnitude of Vi on yz-plane and arrows only show velocity direction |
The results of pore pressure show the flow of blood and fluid in tissue and indicate that fluid seepage from the capillary vessel into the peripheral tissues on the arteriole end (see Fig. 5(a)), and thus soon partly return into the capillary vessel from the tissue near the arteriole end (see Figs. 5(b) and 6(b)). In the middle of the capillary,fluid seepage from the capillary vessel to the body tissue (see Figs. 5(c) and 5(d)),and thus near the venule end of the capillary,small amount of fluid partly return into the capillary vessel (see Figs. 5(e) and 6(e)). On the venule end of capillary,finally fluid is drawn from the tissue into the capillary vessel (see Fig. 5(f)). Namely,the counter-current flow (from tissue to capillary) located occurs near the arteriole end and venule end of capillary.
This particular phenomenon reflects an unique feature of the fluid field in the microcirculation, because this counter-current flow allows oxygen to be transported to each cell uniformly. That is,when the arterial blood reaches single capillaries,the oxygen concentration in the blood is much higher than that in the peripheral tissues. This causes a tremendous concentration difference between the capillaries and the tissue. As a result,oxygen diffuses rapidly from the capillary blood into its surrounding tissue,where excess oxygen would partly be stocked. Thus, to supply adequate oxygen to cells that are further away from the arteriole end,the oxygen near the arteriole end must partly return to the capillary vessel from the tissue to be carried to other regions through the blood. This is a more efficient method of supplementing and consuming oxygen for all body cells. The sudden change in pore pressure gradient allows the oxygen to partly return into the capillary by convection-diffusion. Similarly,because the oxygen in the blood continues to be carried to the tissues,oxygen within the capillary becomes depleted near the venule end,meaning that the oxygen concentration within the tissue near the venule end becomes relatively higher. To reach cells that are farther from the arteriole end,the oxygen has to partly return to the capillary near the venule end. A certain percentage of oxygen in the blood must be carried into the venule (PO2=5 332.9Pa at the venule end). At the venule end of the capillary,deoxygenated blood is carried from the tissues back to the heart. If some non-homogenous materials could be produced surrounding the arteriole end physiologically that leads the permeability in arteriole end to be less,the counter-current flow might not appear. But if only basing on the heterogeneity of capillaries and tissue,this counter-current flow would appear. The results also may provide some explanations for why more fluid is often found in the tumor tissue. For example,high permeability coefficient together with a high tissue boundary pressure may lead to the counter-current flow,which in turn causes more fluid to be stocked within the tissue,and thus oxygen transport is affected.
The effect of different permeability coefficients on the counter-current flow is examined in Fig. 8. This indicates that counter-current flow becomes more obvious with the increasing permeability coefficient,which agrees with the study[39]. He and Himeno[39] showed that the interstitial fluid will be reabsorbed into the capillary and that counter-current flow occurs near the outlet end if the seepage is sufficiently strong.
 |
| Fig. 8 Effect of permeability coefficient on counter-current flow: comparisons of distribution of pore pressure in xy-slices between k1=8× −6 cm·s−1 (left column) and k1=8×10⁻⁸ cm·s−1 (right column) (unit of pore pressure is N/cm2) |
Oxygen concentration given by the present coupled model are shown by the distribution of concentration in some xy-slices in the left column of Fig. 9,which can clearly indicate how the oxygen concentration varies from capillary to surrounding tissues,and also shown by the distribution of concentration in some yz-slices in the left column of Fig. 10,which can clearly indicate how the oxygen concentration varies in the direction of blood flow. It can be observed that oxygen concentration gradient in tissues changes little,especially in the middle of capillary vessel,also be found that oxygen concentration reduces rapidly in the front of capillary vessel, but reduces very slowly from around z=200μm. This also agrees with the physiology that when arterial blood reaches capillary bed,oxygen in plasma is immediately transported to tissues, then is evenly supplied to all the individual cells,which accomplished in the middle of capillary vessel.
 |
| Fig. 9 Comparison of oxygen concentration distribution in xy-slices given by coupled solid deformation, fluid seepage,convection-diffusion,and molecular diffusion model,i.e.,this present model (left column),by coupled fluid seepage,convection-diffusion,and molecular diffusion model with no coupling solid deformation (middle column),and by pure molecular diffusion model with no coupling convection (right column). Three models use same parameters: diffusion coefficient D1=2×10⁻⁶ cm2·s−1 and permeability coefficient k1=8×10⁻⁶ cm·s−1 used in coupled model,and xy-slices are located at (a) z=0 μm,(b) z=100 μm,(c) z=300 μm,and (d) z=500 μm (unit of oxygen concentration is mL · mL−1) |
To study how convection-diffusion impacts on oxygen transport,comparing with the oxygen concentration given by the coupled convection-diffusion and molecular diffusion model,the third column of Fig. 9 and the second column of Fig. 10 give the distribution of oxygen concentration given by the pure molecular diffusion model in xy-slices and in yz-slices,respectively. The same parameters are used for their comparison in Figs. 9 and 10. For further discussing the effect of convection-diffusion on oxygen transport,we denote the oxygen concentration obtained from the coupled model of convection-diffusion and molecular diffusion as Ccoupled and that obtained from the pure molecular diffusion model as Cdiff. The relative difference in oxygen concentration between the two models can be calculated by (18). This gives the relative effect of convectiondiffusion to molecular diffusion.
 |
| Fig. 10 Comparison of oxygen concentration distribution along direction of blood flow given by coupled solid deformation,fluid seepage,convection-diffusion,and molecular diffusion model, i.e.,this present model (left column),by the coupled fluid seepage,convection-diffusion,and molecular diffusion model,i.e.,no coupling solid deformation (middle column),and by pure molecular diffusion model,i.e.,no coupling convection (right column). Three models use same parameters: diffusion coefficient D1 = 2 × −6 cm2 · s−1 and permeability coefficient k1 = 8× −6 cm · s−1 used in coupled model,and yz-slices are located at (a) x=0 μm,(b) x=4.5 μm,(c) x=12 μm,and (d) x=18 μm (unit of oxygen concentration is mL · mL−1) |

 |
| Fig. 11 Comparison of relative effect of convection-diffusion for different values of permeability coefficient and diffusion coefficient. Vertical axis shows relative difference of oxygen concentration of each line at y-direction in xy-slices,calculated by (18),which corresponds to slice number i along horizontal axis. There are 10 points between each value of i and i+1 corresponding to 10 lines in ith xy-slice located at x=0,1.5,3,3.3,4.5,6,9,12,15,and 18 μm. Slices 1 to 14 correspond to z=0,50,100,150,200,250,300,350,400,450,500,550,600,and 630 μm. Relative difference of convection-diffusion to molecular diffusion on oxygen transport is in cases of (a) D1 = 2×10⁻⁵,(b) D1 = 2 × −6,and (c) D1 = 2×10⁻⁷ with unit of cm2 · s−1. Pink (—— + ) denotes k1=8×10⁻⁸ and blue (—— × ) denotes k1=8 × −6 with unit of cm · s−1 |
Though a few theoretical models considered the deformable porous media in the numerical simulation for microcirculation[31, 32],they failed to model the deformation of circulatory structure according to the physiological power source of the capillary fluctuation. For example, in Ref. [31],the solute flux and convective flux in a porous medium were investigated using a mechano-electrochemical mixture theory and the dynamic unconfined compression test configuration for solute desorption experiments was carried out to simulate the solid deformation in a porous medium. Thus,basing on the experimental data of the pressure variations for capillary fluctuation,we couple the solid deformation with the fluid seepage which has not been found in other models. How solid deformation affect oxygen transport can be examined by comparing the oxygen concentration given by the coupled fluid solid seepage and deformation model (Ccoupled) and by the pure seepage model (denoted as Cnodefor). Cnodefor in xy-slices shown in the second column of Fig. 9 indicate that solid deformation has an impact on oxygen transport but not too much,and the effect is greater in the front of capillary than that in the latter of capillary. Moreover,the relative difference between the both models,i.e.,(Ccoupled − Cnodefor)/Cnodefor, in the direction of blood flow is shown in Fig. 12. From this,we can see that the relative effect of solid deformation to oxygen concentration in the direction of capillary is about 0.5% maximum and 0.3% average. From comparing the first column and the second column in Fig. 10,it can be observed the significant impact of solid deformation in oxygen transport is that the solid deformation can help the fluid to seepage more uniformly,further can help the oxygen to be transported more uniformly.
 |
| Fig. 12 Comparison of relative difference in oxygen distribution given by this present coupled model and by model with no solid deformation,when k1=8× −6 cm·s−1 and D1=2× −6 cm2·s−1. Vertical axis shows relative difference of oxygen concentration of each line at y-direction in xy-slices,calculated by (Ccoupled − Cnodefor)/Cnodefor,which corresponds to slice number i along horizontal axis. There are 10 points between each value of i and i+1 corresponding to 10 lines in ith xy-slice located at x=0,1.5,3,3.3,4.5,6,9,12,15,and 18 μm. Slices 1 to 14 correspond to z=0,50,100,150,200,250,300,350,400,450,500,550,600,and 630 μm |
The present study numerically simulates an entire process of oxygen transport at the level of microcirculation by developing a 3D coupled solid deformation-fluid seepage-convection and diffusion porous media model,which newly takes account of volumetric deformation of both capillary and tissue resulting from capillary fluctuation,and couples the deformations into seepage,then,the seepage coupled the deformation affects on convection-diffusion of oxygen. We quantitatively examine how solid deformation,fluid seepage and convection-diffusion affect the transport of oxygen,and have some important findings as follows:
(i) Solid deformation is more significant in the middle of a capillary,where the maximum value of volumetric deformation reaches about 0.5%.
(ii) Though solid deformation has a small impact on seepage,it can exert a positive influence on the tissue fluid so that it flows more uniformly,and it can also cause the oxygen to be transported more uniformly,which eventually impacts on the distribution oxygen concentration by 0.1%-0.5%.
(iii) The change in pore pressure distribution within the tissue near the arteriole end and near the venule end of a capillary is several times larger than that within the tissue surrounding the middle of the capillary.
(iv) Convection-diffusion given by coupled deformation and seepage has a maximum (16%) and average (3%) increase in oxygen concentration,compared to pure diffusion. Its more significant role is to allow oxygen to be transported more evenly,especially away from the capillary.
(v) Convection-diffusion has a greater effect in the middle of a capillary than that near the ends of a capillary. Also,larger values of the permeability coefficient,or smaller values of the diffusion coefficient,produce a more obvious effect on oxygen transport. Thus,this numerical results from this more comprehensive theoretical model indicate that the convection-diffusion of oxygen transport should be necessary to be considered in the relevant studies,its important role of allowing oxygen to be transported more uniformly should be paid more attention and studied further.
| [1] | Pittman, R. N. Oxygen gradients in the microcirculation. Acta Physiologica, 202(3), 311-322 (2011) |
| [2] | Skalak, R. Mechanics of the Microcirculation, 1st ed., Prentice-Hall, New Jersey, 457-499 (1971) |
| [3] | Den Uil, C. A., Klijn, E., Lagrand, W. K., Brugts, J. J., Ince, C., Spronk, P. E., and Simoons, M. L. The microcirculation in health and critical disease. Progress in Cardiovascular Diseases, 51(2), 161-170 (2008) |
| [4] | Abularrage, C. J., Sidawy, A. N., Aidinian, G., Singh, N., Weiswasser, J. M., and Arora, S. Evaluation of the microcirculation in vascular disease. Journal of Vascular Surgery, 42(5), 574- 581 (2005) |
| [5] | Michel, C. C. Handbook of Physiology: the Cardiovascular System, 1st ed., American Physiological Society, Bethesda, 375-410 (1984) |
| [6] | Landis, E. M. and Pappenheimer, J. R. Handbook of Physiology: Circulation, 1st ed., American Physiological Society, Washington D. C., 961-1034 (1963) |
| [7] | Krogh, A. The number and distribution of capillaries in muscles with calculations of the oxygen pressure head necessary for supplying the tissue. The Journal of Physiology, 52(6), 409-415 (1919) |
| [8] | Krogh, A. The supply of oxygen to the tissues and the regulation of the capillary circulation. The Journal of Physiology, 52(6), 457-474 (1919) |
| [9] | Middleman, S. Transport Phenomena in the Cardiovascular System, Wiley-InterScience, New York, 116-140 (1972) |
| [10] | Goldman, D. Theoretical models of microvascular oxygen transport to tissue. Microcirculation 15(8), 795-811 (2008) |
| [11] | Popel, A. S. Theory of oxygen transport to tissue. Critical Reviews in Biomedical Engineering, 17(3), 257-321 (1989) |
| [12] | Pittman, R. N. Regulation of Tissue Oxygenation, 1st ed., Morgan and Claypool Life Sciences, San Rafael, 1-100 (2011) |
| [13] | Greene, A. S., Tonellato, P. J., Zhang, Z., Lombard, J. H., and Cowley, A. J. Effect of microvascular rarefaction on tissue oxygen delivery in hypertension. American Journal of Physiology, 262(5), 1486-1493 (1992) |
| [14] | McGuire, B. J. and Secomb, T. W. A theoretical model for oxygen transport in skeletal muscle under conditions of high oxygen demand. Journal of Applied Physiology, 91(5), 2255-2265 (2001) |
| [15] | Mikelic, A. and Primicerio, M. A diffusion-consumption problem for oxygen in a living tissue perfused by capillaries. Nonlinear Differential Equations and Applications, 13(3), 349-367 (2006) |
| [16] | Yulianti, K. and Gunawan, A. Y. An asymptotic study for the steady model of oxygen diffusion in tissue region. ITB Journal of Science, 44(2), 164-178 (2012) |
| [17] | Grinberg, O., Novozhilov, B., Grinberg, S., Friedman, B., and Swartz, H. M. Axial oxygen diffusion in the Korgh model: modifications to account for myocardial oxygen tension in isolated perfused rat hearts measured by EPR oximetry. Advances in Experimental Medicine and Biology, 566, 127-134 (2005) |
| [18] | Titcombe, M. S., Titcombe, E. S., and Michael, M. J. An asymptotic study of oxygen transport from multiple capillaries to skeletal muscle tissue. Journal of Applied Mathematics, 60(5), 1767- 1788 (2000) |
| [19] | Salathe, E. P. Mathematical analysis of oxygen concentration in a two dimensional array of capillaries. Journal of Mathematical Biology, 46(4), 287-308 (2003) |
| [20] | Sharma, G. C. and Jain, M. A computational solution of mathematical model for oxygen transport in peripheral nerve. Computers in Biology and Medicine, 34(7), 633-645 (2004) |
| [21] | Hellums, J. D., Nair, P. K., Huang, N. S., and Oshima, N. Simulation of intraluminal gas transport in the microcirculation. Annals of Biomedical Engineering, 24(1), 1-24 (1996) |
| [22] | Moschandreou, T. E., Ellis, C. G., and Goldman, D. Influence of tissue metabolism and capillary oxygen supply on arteriolar oxygen transport: a computational model. Mathematical Biosciences, 232(1), 1-10 (2011) |
| [23] | Pozrikidis, C. and Farrow, D. A. A model of fluid flow in solid tumors. Annals of Biomedical Engineering, 31(2), 181-194 (2003) |
| [24] | Pozrikidis, C. Numerical simulation of blood and interstitial flow through a solid tumor. Journal of Mathematical Biology, 60(1), 75-94 (2010) |
| [25] | Chapman, S. J., Shipley, R. J., and Jawad, R. Multiscale modeling of fluid transport in tumors. Bulletin of Mathematical Biology, 70(8), 2334-2357 (2008) |
| [26] | Wang, P. and Olbricht, W. L. Retro-convection enhanced drug delivery: a computational study. Annals of Biomedical Engineering, 38(8), 2512-2519 (2010) |
| [27] | Schuff, M. M., Gore, J. P., and Nauman, E. A. A mixture theory model of fluid and solute transport in the microvasculature of normal and malignant tissues, I, theory. Journal of Mathematical Biology, 66(6), 1179-1207 (2013) |
| [28] | Schuff, M. M., Gore, J. P., and Nauman, E. A. A mixture theory model of fluid and solute transport in the microvasculature of normal and malignant tissues, II, factor sensitivity analysis, calibration, and validation. Journal of Mathematical Biology, 67(6-7), 1307-1337 (2013) |
| [29] | Pittman, R. N. Oxygen transport in the microcirculation and its regulation. Microcirculation, 20(2), 117-137 (2013) |
| [30] | Popel, A. S., Goldman, D., and Vadapalli, A. Modeling of oxygen diffusion from the blood vessels to intracellular organelles. Advances in Experimental Medicine and Biology, 530, 485-495 (2003) |
| [31] | Yao, H. and Gu, W. Y. Convection and diffusion in charged hydrated soft tissue: a mixture theory approach. Biomechanics and Modeling in Mechanobiology, 6(1-2), 63-72 (2007) |
| [32] | Byrne, H. and Preziosi, L. Modelling solid tumour growth using the theory of mixtures. Mathematical Medicine and Biology, 20(4), 341-366 (2003) |
| [33] | Zweifach, B. W. Quantitative studies of microcirculatory structure and function, II, direct measurement of capillary pressure in splanchnic mesenteric vessels. Circulation Research, 34(6), 858- 866 (1974) |
| [34] | Bear, J. Dynamics of Fluids in Porous Media, Elsevier, New York (1988) |
| [35] | Hall, J. E. Guyton and Hall Textbook of Medical Physiology, 12th ed., Elsevier Saunders, New York, 495-504 (2010) |
| [36] | Casciari, J. J., Sotirchos, S. V., and Sutherland, R. M. Variation in tumour cell growth rates and metabolism with oxygen-concentration, glucose-concentration and extracellar pH. Journal of Cellular Physiology, 151(2), 386-394 (1992) |
| [37] | Anderson, A. R. A. A hybrid mathematical model of solid tumor invasion: the importance of cell adhesion. Mathematical Medicine and Biology, 22(2), 163-186 (2005) |
| [38] | Caro, C. G., Pedley, T. J., Schroter, R. C., and Seed, W. A. The Mechanics of the Circulation, 2nd ed., Oxford University Press, Cambridge, 368-372 (2012) |
| [39] | He, Y. and Himeno, R. Finite element analysis on fluid filtration in system of permeable curved capillary and tissue. Journal of Mechanics in Medicine and Biology, 12(4), 1250077 (2012) |
| [40] | Liu, G., Gabhann, F. M., and Popel, A. S. Effect of fiber type and size on the heterogeneity of oxygen distribution in exercising Skeletal muscle. PLoS ONE, 7(9), 44375 (2012) |
| [41] | Cai, Y., Xu, S., Wu, J., and Long, Q. Coupled modeling of tumor growth and blood perfusion. Journal of Theoretical Biology, 279(1), 90-101 (2011) |
| [42] | Zhu, Q., Zhang, A., Liu, P. X., and Xu, L. Study of tumor growth under hyperthermia condition. Computational and Mathematical Methods in Medicine, 2012, 198145 (2012) |
| [43] | Macklin, P. and Lowengrub, J. Nonlinear simulation of the effect of microenvironment on tumor growth. Journal of Theoretical Biology, 245(4), 677-704 (2007) |