 2016, Vol. 37
Shanghai University
Article Information
- Shiliang HU, Chuanjing LU, Yousheng HE. 2016.
- Fluid-structure interaction simulation of three-dimensional flexible hydrofoil in water tunnel
- Appl. Math. Mech. -Engl. Ed., 37(1): 15-26
- http://dx.doi.org/10.1007/s10483-016-2011-9
Article History
- Received Mar. 8, 2015;
- in final form May 15, 2015


2. Ministry of Education(MOE)Key Laboratory of Hydrodynamics, Shanghai Jiao Tong University, Shanghai 200240, China
Recently, hydrofoil blades of marine propellers, turbomachinery, and blood pump have been designed with a light weight and a thin profile to increase the efficiency. Because of the lack of structure rigidity, the fluid loads induce structure oscillation, and inversely the time-space distribution of the flow can also be influenced by the structure motion, which means that the interaction between the fluid and the structure cannot be ignored.
Although much effort has been made in the fluid-structure interaction (FSI) for aerodynamics application[1, 2], relatively few works show concern for hydro-elasticity. Amromin and Kovinskaya[3] analyzed the vibration of a two-dimensional elastic wing with an attached cavity in a periodically perturbed flow. The fluid was assumed to be ideal incompressible, and the cavitating flow was considered as the steady flow. The wing camber line was described as a simple beam equation. As a result, two frequency bands were found, i.e., a high-frequency band associated mainly with the elastic resonant natural frequencies of the foil and a low-frequency band associated with cavity-volume oscillations. Zhang et al.[4] studied numerically and experimentally the dynamic FSI effect of the turbulent flow in a true three-dimensional blade passage of a Francis hydro-turbine. In the simulation, an integrated code of the large eddy simulation (LES) and the finite element method (FEM) was used. The results indicated that the influence of the blade vibration on the near wall flow structures is quite remarkable. However, the cavitation phenomenon was not considered in their work. Campbell and Paterson[5] developed and implemented an FSI solver, which used the OpenFOAM software for the flow and mesh motion solver and an author-developed structural solver to model a quasi-steady problem of a single three-dimensional foil vibration in water. Water tunnel testing was also performed, which was compared with the simulation result to validate the solver. The results exhibited that solver convergence needs several sub-iterations for the fluid-structure coupling even for steady problems. Torre et al.[6] investigated the influence of leading edge sheet cavitation and supercavitation on the added mass effects of a two-dimensional-hydrofoil experimentally in a hydrodynamic tunnel. It was shown that the added mass decreases when the cavity length is increased, and the added mass coefficient is also related to the specific mode shape deformation of the foil. Young[7] presented a coupled approach of the boundary element model (BEM) and the FEM to study the fluid structure interaction of flexible composite propellers in subcavitating and cavitating flows. The feasibility of the passive hydroelastic tailoring of composite marine propellers was discussed. Ducoin et al.[8] analyzed the structural response of a rectangular cantilevered flexible hydrofoil subjected to various flow regimes through the experiment carried out in a hydrodynamic tunnel. The vibrations and displacements of the tip were measured together with the cavitation observed on the suction side of hydrofoil. The results obtained a better understanding of the cavitation-structure interaction and provided experimental data for the development of the high fidelity FSI model.
In the present work, the FSI effects on a three-dimensional cantilevered hydrofoil in the water tunnel are numerically investigated. The hydrodynamic performences and structure responses of the flexibe foil with various attack angles and Reynolds numbers are presented and compared with the experimental measurements. The influence of the FSI on the partial cavity on the foil is studied. The coupled FSI solver is based on the closely coupled approach[9]. The Reynoldsaveraged Navier-Stokes (RANS) equations for the fluid domain are solved by the finite volume method (FVM), and the structure domain is calculated by the FEM.
2 Mathematicalmodel 2.1 Governing equations of fluidIn the current work, the liquid water is assumed to be an incompressible Newtonian fluid with constant viscosity, and the vapor is assumed to be an ideal gas. The mixture model is used to model the multiphase (liquid water and vapor) flow, and the volume fractions of these two phases have the relation


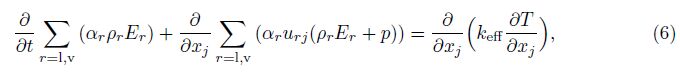


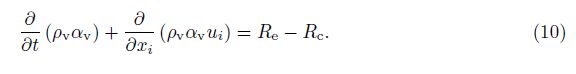
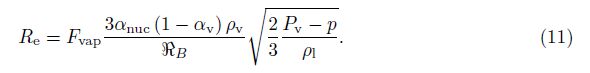
The Zwart-Gerber-Belamri cavitation model[12] is used to describe the mass transfer due to evaporation and condensation. The volume fraction equation for the vapor phase αv is
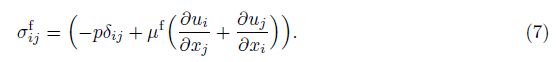
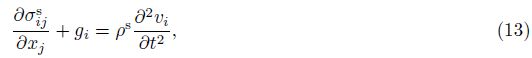
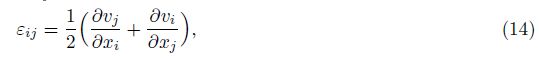
The structure is treated to be elastic with small deformation, and the damping effect is neglected. The material of hydrofoil is considered to be isotropic. Then, the equilibrium equations, the geometrical equations, and the constitutive equations are, respectively,

Because the closely coupled approach is selected to simulate the FSI problems, the conditions of the interface between the structure and the fluid are explicit. It requires that the forces on the interface are in balance, and the velocities on the interface are continuous.
In the structure domain, the normal stress on the interface should be equal to that of the fluid domain, which is expressed as

In the fluid domain, the no-slip condition is used on the interface, which means that the fluid on the interface follows the movement of the structure,

The closely coupled method is used to simulate the fluid-structure coupling. The calculation loop in each coupling iteration k within a time step is shown in Fig. 1. This loop will continue until the iteration number k achieves the set value ks or both of the fluid and the structure solver have acquired convergence. Then, the FSI co-simulation advances to the next time step. The fluid and structure grids are unmatched at the interface. Therefore, the interpolation is required before the data transfer executing. The interpolation technique used in the present work is called the smart bucket algorithm presented in Ref. [14]. The underrelaxation is also used to achieve convergence.

|
| Fig. 1 Flow chart of coupled solution algorithm |
The FSI effect of a three-dimensional rectangular hydrofoil in the water tunnel is numerically studied. The fluid domain is 1m long and has a 0.192m square cross section, which is shown in Fig. 2. The hydrofoil is an NACA66 with a camber ratio of 2% and a relative thickness of 12%[15]. The chord is c = 0.15m, and the span is b = 0.191m. One end of the hydrofoil is fixed on the wall of the tunnel, and the other end is set free. The gap between the free end and the vertical wall is 1 mm. The hydrofoil can rotate about the axis S located at x/c = 0.5 to change the angle of attack. The point A is the leading point at the free end of the hydrofoil. The flexible hydrofoil has a polyacetal (POM) material with ρs = 1 480 kg/m3, E = 3 000MPa, and ν = 0.35. The wedge grid is applied near the hydrofoil in the fluid domain to adapt the deformation of the FSI interface. Three layers of meshes are set between the tip of hydrofoil and the wall (see Fig. 3). The structure domain is discretized by 20 nodes of hexahedron finite element. Figure 4 gives the elements of structure with the deflection.

|
| Fig. 2 Geometric properties of fluid domain |

|
| Fig. 3 Cross-section of fluid mesh |

|
| Fig. 4 Structure elements with deformation shape |
The fluid solver is verified and validated with three meshes which consist of about 4×10⁵, 7×10⁵, and 9×10⁵ cells, respectively. The flow velocity is set to be 5 m/s with the Reynolds number Re = ρluc/μl = 7.5×10⁵. The angle of incidence of the hydrofoil is α = 8°, and the flexibility of the hydrofoil is neglected in these cases. Figure 5 gives the pressure distribution on the suction and the pressure side of the hydrofoil at four cross sections. It shows that the results of three meshes are nearly the same except for a little difference near the tip of hydrofoil (z/b = 1). The lift coefficients on the hydrofoil of three meshes are compared with the experimental results[16], and good agreement is shown (see Table 1). The error also indicates that the middle mesh with 7×10⁵ cells is small enough to model this fluid motion, and it is used as the fluid domain mesh of the FSI simulation.

|
| Fig. 5 Pressure distribution on foil with different mesh densities at various z/b |

The grid convergence of the FSI code is also tested by the case mentioned before, while the hydrofoil is considered as a deformable one. The middle fluid mesh (7×10⁵ cells) combined with three different structure meshes (3 310, 7 875, and 18 380 cells) is used. The vertical displacement of the point A versus time is shown in Fig. 6. It is shown that the difference of time history reduces as the structure mesh increases. The displacement finally converges to a constant value for all three meshes, which means that the vibration of the point A measured in the experiment[8] is not reproduced by the simulation. This is because the amplitude of vibration is quite small and about 10% of the mesh spacing near the hydrofoil. However, it can be seen in Table 2 that the final displacement of the point A agrees well with the static displacement given in Ref. [8]. The structure mesh with 7 875 cells is chosen in the FSI coupling calculation.

|
| Fig. 6 Vertical displacement of tip point A versus time for different mesh densities |

Then, the fluid-structure coupled motion of the flexible hydrofoil is simulated for various Reynolds numbers and angles of incidence. The pressure in the water tunnel is adjusted to ensure that no cavitation happens. In Fig. 7, the displacement of the point A caused by the hydrodynamic loads (Re = 7.5×10⁵) is compared with the experimental measurements[8]. It is shown that the numerical results match better at high attack angles (α > 5°), which means that the FSI model has more efficiency when the boundary layer is turbulent over the hydrofoil. The hydrodynamic loads on the foil can also induce the clockwise twist deformation, and the additional angle of incidence in turn improves the lift on the foil. In Fig. 8, it can be seen that this FSI effect is much more obvious as the initial incidence angle raises.

|
| Fig. 7 Displacement of point A for various incidence angles |

|
| Fig. 8 Lift coefficient on rigid and flexible foils |
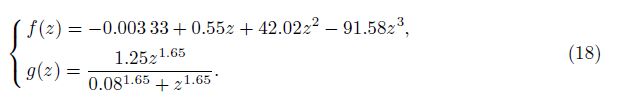
The twist angle of tip section and the vertical displacement of the point A for different Reynolds numbers (Re = 4.5×10⁵, 7.5×10⁵, and 1.2×10⁶) and initial attack angles (α = 4°, 6°, 10°, and 12°) are shown in Fig. 9 and Fig. 10, respectively. It is displayed in Fig. 9 that the twist angle increases with the growth of Reynolds number, and the proportion of the twist angle to the initial angle remains nearly constant for the same Reynolds number. As illustrated in Fig. 10, the displacement of the point A increases linearly with the incidence angle, and the high Reynolds numbers can improve the increasing rate. The twist angle along the span of hydrofoil and the displacement of the axis S are normalized by their maximum values in Fig. 11. The results of scaling show good consistency for different Reynolds numbers and initial angles of attack. The fitting functions g(z) and f(z) are given as follows:

|
| Fig. 9 Proportion of twist angle at tip section to initial angle |

|
| Fig. 10 Displacement of tip point A |
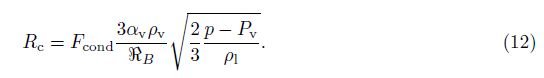
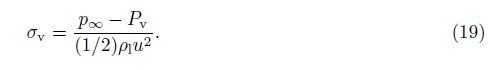
The investigation under the FSI in the cavitation flows under the initial angle α = 8° is also carried out with Re = 7.5×10⁵. Decreasing the pressure P∞ in the water tunnel, four cases with the cavitation numbers σv = 2.55, 2.29, 2.22, and 2.11 are simulated, where σv is defined by

|
| Fig. 11 Normalized twist angle and displacement of axis S |

|
| Fig. 12 Maximum displacement versus maximum cavity length |

|
| Fig. 13 Normalized twist angle and displacement of axis S in cavitation flow |
Figure 14 displays the unsteady process of the partial cavity on the flexible foil with σv = 2.55 and σv = 2.11. It appears that the deformation of the hydrofoil is small, and its effect on the developing process of cavity is limited. The typical characteristic of the cavity shedding can be seen in Fig. 14. It is shown that the reentrant jet cuts the cavity in Figs. 14(b) and 14(c). The cloud cavity sheds and rolls up in Figs. 14(d) and 14(e), and the collapse of the cloud cavity and the growth of the new cavity are presented in Fig. 14(f). Moreover, due to the gap between the foil and the tunnel wall, the tip cavitation occurs for both two cavitation numbers.
The cavitation increases the vibration of the flexible foil, and the FSI simulation captures this coupled motion. Figs. 15 and 16 give the time histories of the displacement and velocity of the point A and the lift on the hydrofoil at σv = 2.55 and σv = 2.11, respectively. They present that the variation of the lift and tip displacement has the same phase, while a phase angle of φ ≈ π/2 appears between the lift and velocity. It also can be seen that the vibration frequency of σv = 2.55 is higher than that of σv = 2.11. Figs. 17 and 18 show the frequency spectrum of the lift on the rigid and flexible foils under these two cavitation numbers. In the case of σv = 2.55, the oscillation of the lift on the rigid foil has no obvious periodicity. When the foil is flexible, a single frequency peak about 40 Hz, which is close to the first bending frequency of the hydrofoil in water (f1 = 43Hz), dominates the fluctuation of the lift. In the case of σv = 2.11, the spectrum of the rigid foil only has one main frequency (about 20 Hz) related to the cloud cavity shedding, while the spectrum of the flexibe foil has two peaks. The lower frequency is related to the pulsation of the cavity which is modified to be 23 Hz, and the higher frequency associates with the vibration of the foil.

|
| Fig. 14 Density contour at z/b = 0.5 and hydrofoil with iso-surface of αv = 0.5 |

|
| Fig. 15 Time history of displacement and velocity of point A and lift on hydrofoil at σv = 2.55 |

|
| Fig. 16 Time history of displacement and velocity of point A and lift on hydrofoil at σv = 2.11 |

|
| Fig. 17 Lift spectrum for rigid and flexible foils when σv=2.55 |

|
| Fig. 18 Lift spectrum for rigid and flexible foils when σv=2.11 |
In the present work, the closely coupling approach is selected as the coupling strategy in the FSI modeling. The fluid governed by the ALE flow formula is simulated by the FVM. The structure described by the equations in the Lagrangian representation is solved by the FEMs. The grid convergence of the fluid solver and the FSI solver is tested, and the numerical results agree well with the experimental measurements.
The FSI effects on a cantilevered three-dimensional hydrofoil in the water tunnel are numerically studied. For the noncavitating flow, it is shown that the growth of initial angle of incidence and the Reynolds number improves the deformation of the foil, and the clockwise twist deformation increases the lift on the foil. The normalized deformation of the flexible foil does not change with the incidence angles and Reynolds numbers. For the cavitating flow, the influence of the coupled motion on the cavity shedding process and the deformation mode of the foil is limited. However, the FSI effect can be clearly found in the frequency of the hydrodynamic load on the foil. The frequency spectrum of the lift always contains the first bend frequency of the flexible foil.
| [1] | Dowell, E. H. Panel flutter-a review of the aeroelastic stability of plates and shells. AIAA Journal, 8(3), 385-399(1970) |
| [2] | Xiang, J., Yan, Y., and Li, D. Recent advance in nonlinear aeroelastic analysis and control of the aircraft. Chinese Journal of Aeronautics, 27(1), 12-22(2014) |
| [3] | Amromin, E. and Kovinskaya, S. Vibration of cavitating elastic wing in a periodically perturbed flow:excitation of subharmonics. Journal of Fluids and Structures, 14(5), 735-751(2000) |
| [4] | Zhang, L., Guo, Y., and Wang, W. Large eddy simulation of turbulent flow in a true 3D Francis hydro turbine passage with dynamical fluid-structure interaction. International Journal for Numerical Methods in Fluids, 54(5), 517-541(2007) |
| [5] | Campbell, R. L. and Paterson, E. G. Fluid-structure interaction analysis of flexible turbomachinery. Journal of Fluids and Structures, 27(8), 1376-1391(2011) |
| [6] | De la Torre, O., Escaler, X., Egusquiza, E., and Farhat, M. Experimental investigation of added mass effects on a hydrofoil under cavitation conditions. Journal of Fluids and Structures, 39, 173-187(2013) |
| [7] | Young, Y. L. Fluid-structure interaction analysis of flexible composite marine propellers. Journal of Fluids and Structures, 24(6), 799-818(2008) |
| [8] | Ducoin, A., André-Astolfi, J., and Sigrist, J. F. An experimental analysis of fluid structure interaction on a flexible hydrofoil in various flow regimes including cavitating flow. European Journal of Mechanics-B/Fluids, 36, 63-74(2012) |
| [9] | Lian, Y., Shyy, W., Ifju, P., and Verron, E. A computational model for coupled membrane-fluid dynamics. AIAA Paper, 2972, 2492-2494(2002) |
| [10] | Orszag, S. A., Yakhot, V., Flannery, W. S., Boysan, F., Choudhury, D., Maruzewski, J., and Patel, B. Renormalization group modeling and turbulence simulations. International Conference on Near-Wall Turbulent Flows, Elsevier, Amsterdam, 1031-1046(1993) |
| [11] | Coutier-Delgosha, O., Fortes-Patella, R., and Reboud, J. L. Evaluation of the turbulence model influence on the numerical simulations of unsteady cavitation. Journal of Fluids Engineering, 125(1), 38-45(2003) |
| [12] | Zwart, P. J., Gerber, A. G., and Belamri, T. A two-phase flow model for predicting cavitation dynamics. The Fifth International Conference on Multiphase Flow, Yokohama, Japan (2004) |
| [13] | Morgut, M., Nobile, E., and Biluš, I. Comparison of mass transfer models for the numerical prediction of sheet cavitation around a hydrofoil. International Journal of Multiphase Flow, 37(6), 620-626(2011) |
| [14] | Jansen, K. E., Shakib, F., and Hughes, T. J. Fast projection algorithm for unstructured meshes. Computational Nonlinear Mechanics in Aerospace Engineering, A93, 175-204(1992) |
| [15] | Leroux, J. B., Astolfi, J. A., and Billard, J. Y. An experimental study of unsteady partial cavitation. Journal of Fluids Engineering, 126(1), 94-101(2004) |
| [16] | Ducoin, A. and Young, Y. L. Hydroelastic response and stability of a hydrofoil in viscous flow. Journal of Fluids and Structures, 38, 40-57(2013) |