 2016, Vol. 37
Shanghai University
Article Information
- Yizhao WAN, Yuewu LIU, Weiping OUYANG, Guofeng HAN, Wenchao LIU. 2016.
- Numerical investigation of dual-porosity model with transient transfer function based on discrete-fracture model
- Appl. Math. Mech. -Engl. Ed., 37(5): 611-626
- http://dx.doi.org/10.1007/s10483-016-2075-8
Article History
- Received Mar. 27, 2015
- Revised Nov. 22, 2015


2. Changqing Downhole Technology Company, Chuanqing Drilling Engineering Company Limited, China National Petroleum Corporation, Xi'an 710018, China
Naturally fractured reservoirs can be considered as two mediums,rock matrix and fractures. Generally the rock matrix provides the primary storage of fluid while the fractures serve as flow paths. The order of fracture apertures is often 0.1 mm or less. They are very small compared with matrix dimensions. The distribution of fractures is usually random in different scaleorders. All of these make the numerical simulation of fluid flow in naturally fractured reservoirs challenging.
At present,the well testingmodel of fractured reservoir is mainly based on the dual media theory. In 1960,Barenblatt et al.[1] proposed the concept of dual media for naturally fractured reservoirs and established the dual-porosity model (DPM) and dual permeability model. In this model,the cubicmatrix is separated by continuum of fractures. The flow between the matrix system and fracture system is described with an exchange term. In 1963,Warren and Root[2] presented the homogeneous orthotropic dual medium model on the basis of the former,which is currently the most widely used dual medium model. The heart of DPM is the transfer function which defines the flow between the matrix and fractures. This transfer function in Warren-Root model is the pseudo-steady state which implies that the flow in the matrix completes instantaneously. This assumption is not realistic. Inspired by the Warren-Root model,many authors did a lot of research and developed the DPM with the transient transfer function. Kazemi[3] and De Swaan[4] proposed the lamellar and spheroidal DPM. There aretwo important parameters that define the inter-porosity flow between the matrix system and thefracture system,which are the inter-porosity coefficient λ andthe storage factor ω. Also,these two parameters are important for development of oil and gas field because ω determines the amount of fluid,and λ determines the flow capacity from matrix to fracture. Usually,these two parameters are estimated from well test interpretation.
The coefficient λ is correlated to another important parameter which is called the matrix-fracture transfer shape factor α. In a pseudo-steady state,the mass transfer between matrix and fracture is given by
where qc is the exchange rate of fluid,Km is the matrix permeability,μ is the fluid viscosity,ρ is the fluid density,pm is the average matrix block pressure,pf is the fracture pressure,and α is the shape factor,which is a function of the shape of matrix block and the set of fracture.
In a transient state,the diffusion equations of fracture and matrix block are combined with a mass continuity condition. Therefore,it does not use the shape factor directly. However,in order to describe expediently,we still define the coefficient λ with the shape factor as[4]
where rw is the radius of wellbore,and Kf is the permeability of fracture. It implies that we use λ and Kf rather than Km and Kf to describe the transfer flow between matrixand fracture.
It can be concluded that the shape factor α determines the fluid exchange between matrix and fracture. Warren and Root[2] defined dimensionless shape factors of 12,32,and 60 for one,two,and three sets of fractures,respectively. The shape factor derived by Kazemi and Gilman[5] was 4,8,and 12 for one,two,and three sets of fracture. Thomas et al.[6] studied various fine-grid single-porosity and single-block DPMs. They concludedthat the dimensionless shape factor is 25 for a three-dimensional oil-water model with the mobility ratio near the unit. Many other authors derived the shape factors under different conditions and got the analogous form of shape factor[7, 8, 9, 10, 11] . The basic concept is the analysis of a single matrix block surrounded by fractures,which is shown in Fig. 1[12].
 |
| Fig. 1 Schematic of matrix-fracture model (from Ranjbar and Hassanzadeh[12] ) |
The shape factor is calculated by solving the diffusion equation of matrix under the boundary condition of pm(Lc,t) = pf . It should be noted that the pressure of all the boundaries is the same in this model,which implies that the fluid flows from the center of matrix block to the fractures edges[13]. Actually,the pressure of different fractures is not the same. Therefore,the assumption of the constant pressure boundary condition which is essential for solving the diffusion equation would cause the error of result. On the other hand,if we do deep analysis of the DPM with the transient inter-porosity flow,we can find that the flow state of all the matrix blocks is identical,which implies that the exchange rate of all the matrix blocks is the same. However,it is obvious that the exchange rate of the blocks near the production well should be larger than that of the far one. This is the congenital defect of the DPM.
To sum up,the assumption of a constant boundary condition for calculating the shape factor and the congenital defectwill cause some errors for the estimations of λ and ω. In this paper,we develop a fracture network model (FNM) which is closer to the real reservoir. We use the discrete-fracture model[14, 15, 16, 17] to simplifythe fractures and implement a mixed finite-element method to solve the diffusion equations and obtain the pressure behavior of the wellbore. We analyzethe characteristics of bottom hole pressure type curve and flow in porous media. Then,we use this more accurate model to investigate the DPM in the well test which has been applied widely for decades.
2 Physical modelThe transient flow toward a well surrounded by the fracture network is studied.The following assumptions are considered:
(ⅰ) The fracture network develops from x-and y-directions in a rectangle reservoir. The fractures split the matrix as small rectangles of d1 × d2. The wellbore is in an intersection of fractures.
(ⅱ) The fractures permeability is Kf ,and the aperture is w.
(ⅲ) The porous medium contains a slightly compressible fluid of viscosity μ and compressibility C.
(ⅳ) There is no damage zone surroundingthe wellbore,and the effects of gravity,temperature,and other physical and chemicaleffects are ignored. The system above defined is shown in Fig. 2. We call this model the FNM.
 |
| Fig. 2 Sketch of FNM |
In the discrete-fracture model,it is assumed that inside the fracture,all variables remain constant in the lateral direction that is ignoring the pressure gradient of vertical direction. The aperture w offracture appears as an explicit factor in front of the 1D integral for the consistency ofthe integral form. The control equation of the flow in fractures can be simplifiedto the 1D form.
The control equations of this problem are obtained by combining Darcy’s law and the mass conservation based on the discrete-fracture model description. For the matrix,the transient equation of pressure can be written as
where pm is the matrix pore pressure,φm is the matrix porosity,and Ct is the total compressibility.
For fractures,the transient equation of pressure based on the discrete-fracture model can be written as
where φf is the fracture porosity,and l is the local coordinate of fractures,which is shown in Fig. 3.
 |
| Fig. 3 Sketch of fracture local coordinates |
The initial conditions for this problem are as follows:
where pi is the original formation pressure.
The inner boundary condition of constant production rate around wellbore are as follows:
where Lj is the matrix element edge on wellbore,B is the fluid volume factor,q is the production rate,pw is the bottom hole pressure,and N is the number of edges on wellbore.

The constant pressure outer boundary condition of the reservoir is given by
or the closed outer boundary condition of the reservoir is obtained as

The convergence conditions of the matrix and fracture are other very important conditions toclose the equations. One is the pressure continuous condition,which is given by

and another is the rate continuous condition. The fluid flow between matrix and fracture is presented in Fig. 4. The term qm1 + qm2 is the rate flow from matrix to fracture,and qf1 and qf2 are flow rates at both ends of fracture. The following formula can be obtained according to thematerial balance:

 |
| Fig. 4 Rate continuous continuity between matrix and fracture |
The above rates are obtained by Darcy’s law,
where n is the normal direction of fracture. Then,the rate continuous condition is given by


Equations (3)-(9) and (14) combine the closed mathematical model for pressure transient of theFNM. It should be noted that the model that we have developed above does not define any transfer functions between matrix and fracture,and we just use the mass continuity condition which is spontaneous.
3.2 Numerical methodThe geometry is discretized using triangular elements for the matrix and line elements for the fractures,which is presented in Fig. 5. Firstly,the node and triangle are numbered just like normal grids. Secondly,line elements for fractures are marked separately.
 |
| Fig. 5 Discretization of FNM |
In a rectangle of 500 m width and 500 m height reservoirs,the matrix block is 5 m×5 m,which means that the fracturedensities of x-and y-directions are 0.2 piece/m.We use AUTO-CAD to draw the geometry model and import it into GAMBIT to mesh.
We use the Galerkin weighted residual method and finite-element discretization to solve Eqs. (3) and (4). The variational forms of theses equations can be written as

and

The weak forms of these variational equations can be written as

and
The right terms of Eqs. (17) and (18) are the flow rates of the element edges,which can be written as

The flow between the matrix element and the fractureelement is shown in Fig. 6. When all the matrix and fracture element equations combine together,the right terms of Eq. (18) are offsetting using the rate continuous condition of Eq. (11). The right terms of Eq. (17) exit only if the matrix elements are onwellbore. Therefore,the finite-element approach of discrete-fracture model is just adding the line element equations into the 2D total finite-element equations.
 |
| Fig. 6 Flow between matrix triangle element and fracture line element |
The matrix element pressures are approximated as
where pmie,pmje,and pmke are three node pressures,and Nmi is the element interpolating function,which is written as The time derivative term is discretized by forward difference as follows: Then,the matrix element equation is as follows: where


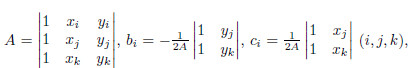 and xi,yi,xj ,yj ,xk ,and yk are the triangle node coordinates.
The same operation is implemented to fracture line elements. The fracture pressure is approximated as
where pfie and pfje are the line element node pressures,Nfi and Nfj are the interpolating functions for the linear line element given by Then,the fracture element equationsare as follows: where L = |li − lj |is the line element length.


The wellbore boundary condition is given by

The fracture matrix system is superimposed on the matrix due to the original non-fracture formulation. This concept is illustrated in Fig. 7.
 |
| Fig. 7 Schematic illustrating combining matrix and fracture element equations |
The bottom hole pressure response curve of FNM is presented in Fig. 8.
 |
| Fig. 8 Bottom hole pressure response curve of FNM (pw : solid line; p'w: dashed lines) |
As seen from Fig. 8,the bottom hole pressure response curve of this mode is very similar with dual-porosity with a transient transfer function,and it can be divided into seven stages.
(ⅰ) Wellbore storage stage
In this stage,the fluid in the wellbore dominates the flow and the pressure,and the pressure derivate curve is a straight line with the slope 1.
(ⅱ) Transition stage
With the decrease of wellbore pressure,the sand face rate increasesinto the well head rate under the pressure difference between the wellbore and the formation. The flow transits from wellbore storage to the formation flow.
(ⅲ) Fracture linear flow stage
Because of high permeability of fractures,the flow occurs firstly in the fractures which are connected directly with wellbore. This stage is similar with the bilinear flow in the vertical fractured well[19]. In this stage,the pressure and pressure derivate curves are parallellines. However,the line slope is not 1/2 or 1/4 as that in the verticalfractured wells,because there are 4 fractures connected with wellbore. When the dimensionless fracture conductivity is greater than300,fractures can be considered as infinite conductivity[19]. Figure 9(a) presents the pressure field of this stage. The pressure expands toward along the fractures connected with wellbore.
(ⅳ) Fracture network flow stage
When the pressure expandsto the fractures perpendicularto the fracturesconnected directly with wellbore,the formation presents the fracture network flow. The pressure field of this stage is shown in Fig. 9(b). The pressure expands along the fracture network.
 |
| Fig. 9 Pressure field of FNM |
(ⅴ) Transformation from matrix to fracture stage
With the decrease of fractures pressure,the fluid flows from matrix to fractures under the pressure difference. In this stage,the pressure derivate curve goes down and forms a concave because of the pressure supply of the matrix. Figure 9(c) presents the pressure field of this stage. It shows that the matrix pressure has been significantly decreased. This is the main feature of the matrix-fracture transfer flow which is determined by λ and ω.
(ⅵ) Radial flow stage
When the transformation from matrix to fractures is steady,the flow is radial,which reflects a horizontal pressure derivate in the bottom hole pressure response curve.
4.2 Upscaling of FNM and comparison with DPMAfter analyzing the pressure behavior,we intend to compare this model with the DPM. However,the parameters of FNM and DPM are not corresponding. Therefore,the first step is toupscale the FNM and calculate equivalent parameters.
The first one is the permeability of the whole system. In the FNM,the parameter Kf is the permeability of fracture,and the system equivalent permeability  ,which exhibitsthe radial flow in Fig. 8,can be calculated by averaging Kf over the whole system[20]. It is given by


 |
| Fig. 10 Matrix block for calculating Vf |
Thus,the upscaling permeability is given by

Now,ω and λ are the only two left parameters which are needed to be upscaled. The definition of ω is given by
In the FNM,we assume that φCt for matrix and fracture is the same. Then,we can get

The definition of λ is given by Eq. (2),but it should be noted that the permeability of fractures is the upscaling value which is calculated from Eq. (30),and the shape factor is for the shape of a quadrangular prism which implies α = 8/(d/2)2.
Up to now,we upscale the FNM and get corresponding parameters to the DPM. The next step is to compare the two models. We regard the results of FNM as field data and use a DPM to do well test interpretation and adjust the parameters of DPM to match the log-log curve of the FNM. Then,we will get the parameters defined in the dual-porosity. The match plot of log-log curves is shown in Fig. 11.
 |
| Fig. 11 Log-log match plot of FNM and DPM (pw: solid line; p'w : dashed lines) |
The DPM does a good fit except for the early fracture linear flow stage,which is obvious because there are not any explicitly fractures connected with wellbore in the DPM. Table 1 lists the parameters for the FNM,the upscaling ones of the FNM,and the interpretative results with the DPM.

The well storage coefficients of the two models are almost the same. The skin factor of the FNM is zero,and it is -2.41 in the DPM. This can be explained by the fact that the fractures connected with wellbore exhibit a negative geometrical skin SG given by[1]
where G is a correction parameter to account for the pressurelosses resulting from the low fracture conductivity. The value of SG can be derived from Fig. 3(10) in Ref. [2],and it turns out to be -3.21. There is an error between the DPM and the FNM. It can be explained by thefact that there are four half-fractures connected with wellbore,and the well test matching is not very precise.
In Table 1,the parameter Kf for the DPM is the permeability of the whole system which is estimated from the radial flow in Fig. 8. It is exactly the same with the result of DPM,which implies that the permeability estimated from the DPM is credible,and the upscaling method of FNM is correct.The value of ω estimated by using the DPM is 0.085 9 which is two orders ofmagnitude larger than the FNM. The value of λ estimated from the DPM is 2.79×10⁻⁵,and itis less than the value of the FNM by 12.80%. These results imply that if we set the same parameters of the FNM and the DPM,the log-log type curves of them will be different before theradial flow stage.
From the comparisonbetween the DPM and the FNM,the DPM can be used to estimate thepermeability of the whole system. However,when it is applied to estimate ω and λ by well test of field data,it will give rise to a big error especially for ω,which affects the judgement of naturally fractured reservoirs. This big error is caused by the congenital defect of the DPM mentioned in the introduction. In the DPM,each of the matrix blocks is in the same state,and the pressure of fracture system is constant in the spacialdomain. Nevertheless,matrix blocks of different distances from wellbore are in different states which implies that the exchange rates of different matrix blocks are different. In Fig. 8(c),we can see that the pressure of fractures varies with distance from wellbore. The exchange rate of the matrix blocks closer to wellbore is much larger than that of the further one. Another cause of the big error is the constant boundary condition for calculation of α presented in Fig. 1. As seen from Fig. 8(c),thepressure of surrounding fractures is not constant. Therefore,we can conclude that the DPM will overestimate ω andunderestimate λ.
4.3 Effect of fracture permeabilityFigure 12 shows the bottom hole pressure response curves of different fracture permeability. As seen,the fracture permeability plays a decisive role on the permeability of the system. It can be explained by Eq. (30). The larger the fracture permeability is,the earlier the fracture linear flow begins,and the latter the transfer flow begins,which can be explained by the fact that the larger fracture permeability implies a smaller λ from Eq. (2).
 |
| Fig. 12 Bottom hole pressure response curves of different fracture permeability (pw : solid line; p'w : dashed lines) |
Also,we choose the case of Kf = 105 mD to compare with the DPM by the method mentioned in Subsection 4.2. The results of two models are listed in Table 2. We can see that the upscaling permeability is just the same as the value of the DPM. The focus should be on ω and λ. From the last two rows,ω estimated from the DPM is almost three orders of magnitude larger than that from the FNM,and λ estimated from the DPM is less than the value of FNM by 17.50%,which coincides with the conclusion of Subsection 4.2.

Figure 13 presents the bottom hole pressure response curves of different matrix permeability. Asshown,the matrix permeability dominates the fracture linear stage and matrix transforma-tion stage. The larger the matrix permeability is,the smaller the slope of pressure and pressure derivate curve is inthe fracture linear stage. The larger matrix permeability leads to the smaller dimensionless fracture conductivity,and the fracture linear flow transfers to the fracture bilin-ear flow. The higher the matrix permeability is,the earlier the pressure derivate curve goes down in the matrix transformation stage. It is just similar to the influenceof λ in the DPM,and this can be explained by the fact that larger Km implies a larger λ from Eq. (2). In Fig. 13,when Km = 10 mD,the matrix transformation stage even covers up the fracture network flow stage. The radial flow stages of Km =10 mD and Km =1 mD are coincident,which implies that the matrix permeability contribution to the whole system is small.
 |
| Fig. 13 Bottom hole pressure response curves of different matrix permeability (pw : solid line; p’w : dashed lines) |
A comparison between the case of Km =10 mD and the DPM is performed,and the results are listed in Table 3. We also focus on ωand λ,and the same conclusion can be made from the lasttwo rows in Table 3.

The fracture density can be obtained from the matrix block size when the reservoir size is fixed. Next,we discuss two kindsof circumstances. The first circumstance is d1 = d2,which means that the matrix block is square. Fracture densitiesof x-and y-directions increase or decrease at the same time. The second is fixing d1 and increasing or decreasing d2.
Figure 14 presents the bottom hole pressure response curves of different fracture density of x-and y-directions. It shows that the fracture linear flow stage sustains shorter with the increase of fracture density. This is because the interference of other direction’s fractures occurs early when the fracture density is large.
 |
| Fig. 14 Bottom hole pressure response curves of different fracture density (pw : solid line; p'w :dashed lines) |
Another influence of fracture density is the permeability of whole system which is obvious from Eq. (30).
The bottom hole pressure response curve of different fracture density in y-direction is plotted in Fig. 15. The effect of this situation is similar to the one shown in Fig. 14.
 |
| Fig. 15 Bottom hole pressure response curve of different fracture density in y-direction (pw : solid line; p'w :dashed lines) |
Figure 16 presents the pressure field of the nonuniform fracture density,which has been discussed in Fig. 15. The pressure expands smaller in the x-direction whose fracture density is larger. The flow in the formation is the elliptic flow.
 |
| Fig. 16 Pressure field of FNM |
We perform a comparison between the case of d1=5 m,d2=15 m and the DPM. However,in this case,the upscaling formulas have to be modified. The volume ratio of fracture is modified to
Then,Eqs. (30) and (32) are appropriate for the situation of nonuniform fracture density. Table 4 lists the results of FNM and DPM. It should be noted that the differences of ω and λ between the FNM and the DPM enlarge in the situation of nonuniform fracture density.

(ⅰ) A fracture network numerical well test model is developed based on the discrete-fractured model. The model equations are solved by finite-element method,and the bottom hole pressure response curve is obtained,which can be divided into seven stages according to the curve type and pressure filed.
(ⅱ) An upscaling method is developed to calculate the corresponding parameters of DPM. Then,the FNM can be used to investigate the DPM. Comparison results show that the DPM overestimates the storage factor ω by two orders of magnitude and the inter-porosity coefficient λ by less than 20%.
(ⅲ) The effects of parameters are analyzed. The fracture permeability dominates the per-meability of the whole system. The larger the fracture permeability is,the earlier the fracture linear flow begins. The matrix permeability dominates the fracture linear stage and matrix transformation stage. The larger the matrix permeability is,the smaller the slope of pressure and pressure derivative curve is in the fracture linear stage,and the earlier the pressure deriva-tive curve goes down in the matrix transformation stage. Fracture density is another parameter which affects the permeability of the whole system. The larger the fracture density is,the higher the permeability of the whole system is. The feature of the fracture linear flow can be covered up when the fracture density is large. In the situation of nonuniform fracture density,the flow iselliptic,and the pressure expands slower along the direction of larger fracture density. All theseeffects are corresponding to effects of ω and λ.
(ⅳ) Comparisons between the FNM and the DPM are also performed under different con-ditions. All these comparisons confirm the fact that the DPM overestimates ω and λ.
| [1] | Barenblatt, G. I., Zheltov, I. P., and Kochina, I. N. Basic concepts in the theory of seepage of homogeneous liquids in fissured rocks [strata]. Journal of Applied Mathematics and Mechanics, 24(5), 1286–1303 (1960) |
| [2] | Warren, J. E. and Root, P. J. The behavior of naturally fractured reservoirs. Society of Petroleum Engineers Journal, 3(3), 245–255 (1963) |
| [3] | Kazemi, H. Pressure transient analysis of naturally fractured reservoirs with uniform fracture distribution. Society of Petroleum Engineers Journal, 9(4), 451–462 (1969) |
| [4] | De Swaan, O. A. Analytic solutions for determining naturally fractured reservoir properties by well testing. Society of Petroleum Engineers Journal, 16(3), 117–122 (1976) |
| [5] | Kazemi, H. and Gilman, J. R. Multiphase flow in fractured petroleum reservoirs. Flow and Contaminant Transport in Fractured Rock, 31(91), 267–323 (1993) |
| [6] | Thomas, L. K., Dixon, T. N., and Pierson, R. G. Fractured reservoir simulation. Society of Petroleum Engineers Journal, 23(1), 42–54 (1983) |
| [7] | Coats, K. H. Implicit compositional simulation of single-porosity and dual porosity reservoirs. SPE Symposium on Reservoir Simulation, Society of Petroleum Engineers, Houston (1989) |
| [8] | Ueda, Y., Murata, S., Watanabe, Y., and Fanatsu, K. Investigation of the shape factor used in the dual-porosity reservoir simulator. SPE Asia-Pacific Conference, Society of Petroleum Engineers, Sydney (1989) |
| [9] | Zimmerman, R. W., Chen, G., Hadgu, T., and Bodvarsson, G. S. A numerical dual-porosity model with semi-analytical treatment of fracture/matrix flow. Water Resources Research, 29(7), 2127–2137 (1993) |
| [10] | Chang, M. M. Analytical Solution to Single and Two-Phase Flow Problems of Naturally Fractured Reservoirs: Theoretical Shape Factor and Transfer Functions, Ph. D. dissertation, University of Tulsa (1995) |
| [11] | Quintard, M. and Whitaker, S. Transport in chemically and mechanically heterogeneous porous media Ⅰ: theoretical development of region-averaged equations for slightly compressible singlephase flow. Advances in Water Resources, 19(1), 29–47 (1996) |
| [12] | Ranjbar, E. and Hassanzadeh, H. Matrix-fracture transfer shape factor for modeling flow of a compressible fluid in dual-porosity media. Advances in Water Resources, 34(1), 627–639 (2011) |
| [13] | Hassanzadeh, H. and Pooladi-Darvish, M. Effects of fracture boundary conditions on matrixfracture transfer shape factor. Transport in Porous Media, 64(1), 51–71 (2006) |
| [14] | Noorishad, J. and Mehran, M. An upstream finite element method for solution of transient transport equation in fractured porous media. Water Resources Research, 3(18), 588–596 (1982) |
| [15] | Baca, R. G., Arnett, R. C., and Langford, D. W. Modeling fluid flow in fractured-porous rock masses by finite-element techniques. International Journal of Methods in Fluids, 4(4), 337–348 (1984) |
| [16] | Kim, J. G. and Deo, M. D. Comparison of the performance of a discrete fracture multiphase model with those using conventional methods. SPE Symposium on Reservoir Simulation, Society of Petroleum Engineers, Houston (1999) |
| [17] | Hoteit, H. and Firoozabadi, A. Compositional modeling by the combined discontinuous Galerkin and mixed methods. Society of Petroleum Engineers Journal, 11(1), 19–24 (2006) |
| [18] | Zhang, D. M., Cai, C. X., Zhang, K. B., Zhan, J. M., and Huang, H. Computational Fluid Mechanics (in Chinese), Sun Yat-sen University Press, Guangzhou (1991) |
| [19] | Cinco-Ley, H. and Samaniego-V, F. Fractured reservoir simulation. Society of Petroleum Engineers Journal, 33(09), 1749–1766 (1981) |
| [20] | Noetinger, B. and Estebenet, T. Up-scaling of double porosity fractured media using continuoustime random walks methods. Transport in Porous Media, 39(1), 315–337 (2000) |
| [21] | Bourdet, D. Well Test Analysis: The Use of Advanced Interpretation Models, Elsevier, Amaterdam, 63–65 (2002) |